

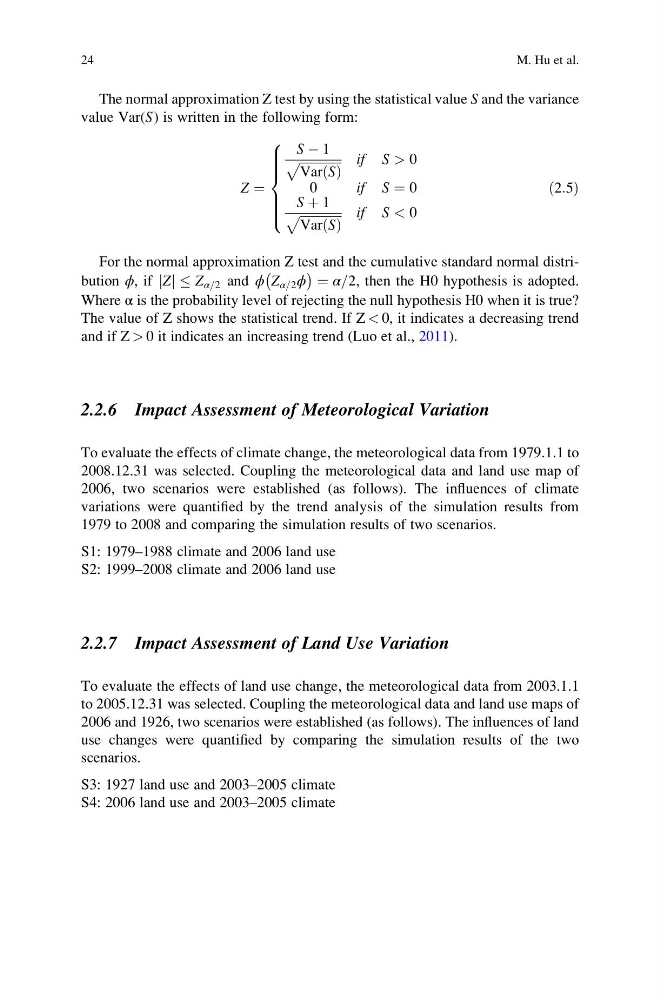
The normal approximation Z test by using the statistical value S and the variance
value Var(S) is written in the following form:
Z ¼
S À 1
ffiffiffiffiffiffiffiffiffiffiffiffiffi ffi
Var S
ð Þ
p
if S > 0
0
if S ¼ 0
S þ 1
ffiffiffiffiffiffiffiffiffiffiffiffiffi ffi
Var S
ð Þ
p
if S < 0
8
> > > > <
> > > > :
ð2:5Þ
For the normal approximation Z test and the cumulative standard normal distribution ϕ, if Z
j j Z α=2 and ϕ Z α=2 ϕ
À
Á ¼ α=2, then the H0 hypothesis is adopted.
Where α is the probability level of rejecting the null hypothesis H0 when it is true?
The value of Z shows the statistical trend. If Z < 0, it indicates a decreasing trend
and if Z > 0 it indicates an increasing trend (Luo et al., 2011).
2.2.6 Impact Assessment of Meteorological Variation
To evaluate the effects of climate change, the meteorological data from 1979.1.1 to
2008.12.31 was selected. Coupling the meteorological data and land use map of
2006, two scenarios were established (as follows). The influences of climate
variations were quantified by the trend analysis of the simulation results from
1979 to 2008 and comparing the simulation results of two scenarios.
S1: 1979–1988 climate and 2006 land use
S2: 1999–2008 climate and 2006 land use
2.2.7 Impact Assessment of Land Use Variation
To evaluate the effects of land use change, the meteorological data from 2003.1.1
to 2005.12.31 was selected. Coupling the meteorological data and land use maps of
2006 and 1926, two scenarios were established (as follows). The influences of land
use changes were quantified by comparing the simulation results of the two
scenarios.
S3: 1927 land use and 2003–2005 climate
S4: 2006 land use and 2003–2005 climate
24
M. Hu et al.
value Var(S) is written in the following form:
Z ¼
S À 1
ffiffiffiffiffiffiffiffiffiffiffiffiffi ffi
Var S
ð Þ
p
if S > 0
0
if S ¼ 0
S þ 1
ffiffiffiffiffiffiffiffiffiffiffiffiffi ffi
Var S
ð Þ
p
if S < 0
8
> > > > <
> > > > :
ð2:5Þ
For the normal approximation Z test and the cumulative standard normal distribution ϕ, if Z
j j Z α=2 and ϕ Z α=2 ϕ
À
Á ¼ α=2, then the H0 hypothesis is adopted.
Where α is the probability level of rejecting the null hypothesis H0 when it is true?
The value of Z shows the statistical trend. If Z < 0, it indicates a decreasing trend
and if Z > 0 it indicates an increasing trend (Luo et al., 2011).
2.2.6 Impact Assessment of Meteorological Variation
To evaluate the effects of climate change, the meteorological data from 1979.1.1 to
2008.12.31 was selected. Coupling the meteorological data and land use map of
2006, two scenarios were established (as follows). The influences of climate
variations were quantified by the trend analysis of the simulation results from
1979 to 2008 and comparing the simulation results of two scenarios.
S1: 1979–1988 climate and 2006 land use
S2: 1999–2008 climate and 2006 land use
2.2.7 Impact Assessment of Land Use Variation
To evaluate the effects of land use change, the meteorological data from 2003.1.1
to 2005.12.31 was selected. Coupling the meteorological data and land use maps of
2006 and 1926, two scenarios were established (as follows). The influences of land
use changes were quantified by comparing the simulation results of the two
scenarios.
S3: 1927 land use and 2003–2005 climate
S4: 2006 land use and 2003–2005 climate
24
M. Hu et al.