

2.3 Results
2.3.1 Variations of Precipitation and Temperature
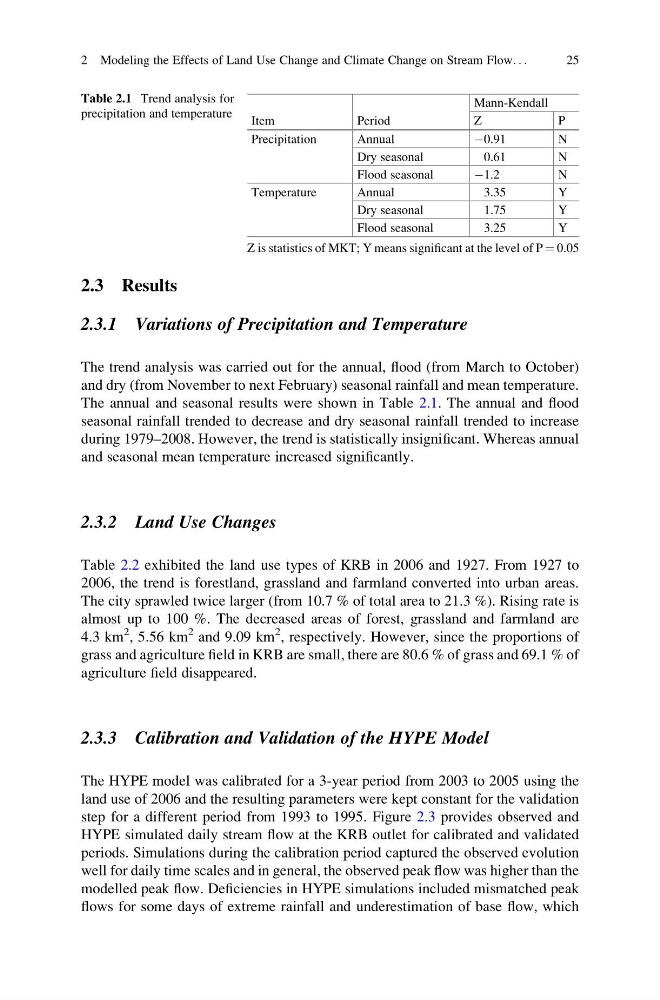
The trend analysis was carried out for the annual, flood (from March to October)
and dry (from November to next February) seasonal rainfall and mean temperature.
The annual and seasonal results were shown in Table 2.1. The annual and flood
seasonal rainfall trended to decrease and dry seasonal rainfall trended to increase
during 1979–2008. However, the trend is statistically insignificant. Whereas annual
and seasonal mean temperature increased significantly.
2.3.2 Land Use Changes
Table 2.2 exhibited the land use types of KRB in 2006 and 1927. From 1927 to
2006, the trend is forestland, grassland and farmland converted into urban areas.
The city sprawled twice larger (from 10.7 % of total area to 21.3 %). Rising rate is
almost up to 100 %. The decreased areas of forest, grassland and farmland are
4.3 km
2 , 5.56 km
2 and 9.09 km
2 , respectively. However, since the proportions of
grass and agriculture field in KRB are small, there are 80.6 % of grass and 69.1 % of
agriculture field disappeared.
2.3.3 Calibration and Validation of the HYPE Model
The HYPE model was calibrated for a 3-year period from 2003 to 2005 using the
land use of 2006 and the resulting parameters were kept constant for the validation
step for a different period from 1993 to 1995. Figure 2.3 provides observed and
HYPE simulated daily stream flow at the KRB outlet for calibrated and validated
periods. Simulations during the calibration period captured the observed evolution
well for daily time scales and in general, the observed peak flow was higher than the
modelled peak flow. Deficiencies in HYPE simulations included mismatched peak
flows for some days of extreme rainfall and underestimation of base flow, which
Table 2.1 Trend analysis for
precipitation and temperature
Item
Period
Mann-Kendall
Z
P
Precipitation
Annual
À0.91
N
Dry seasonal
0.61
N
Flood seasonal
À1.2
N
Temperature
Annual
3.35
Y
Dry seasonal
1.75
Y
Flood seasonal
3.25
Y
Z is statistics of MKT; Y means significant at the level of P ¼ 0.05
2 Modeling the Effects of Land Use Change and Climate Change on Stream Flow. . .
25
2.3.1 Variations of Precipitation and Temperature
The trend analysis was carried out for the annual, flood (from March to October)
and dry (from November to next February) seasonal rainfall and mean temperature.
The annual and seasonal results were shown in Table 2.1. The annual and flood
seasonal rainfall trended to decrease and dry seasonal rainfall trended to increase
during 1979–2008. However, the trend is statistically insignificant. Whereas annual
and seasonal mean temperature increased significantly.
2.3.2 Land Use Changes
Table 2.2 exhibited the land use types of KRB in 2006 and 1927. From 1927 to
2006, the trend is forestland, grassland and farmland converted into urban areas.
The city sprawled twice larger (from 10.7 % of total area to 21.3 %). Rising rate is
almost up to 100 %. The decreased areas of forest, grassland and farmland are
4.3 km
2 , 5.56 km
2 and 9.09 km
2 , respectively. However, since the proportions of
grass and agriculture field in KRB are small, there are 80.6 % of grass and 69.1 % of
agriculture field disappeared.
2.3.3 Calibration and Validation of the HYPE Model
The HYPE model was calibrated for a 3-year period from 2003 to 2005 using the
land use of 2006 and the resulting parameters were kept constant for the validation
step for a different period from 1993 to 1995. Figure 2.3 provides observed and
HYPE simulated daily stream flow at the KRB outlet for calibrated and validated
periods. Simulations during the calibration period captured the observed evolution
well for daily time scales and in general, the observed peak flow was higher than the
modelled peak flow. Deficiencies in HYPE simulations included mismatched peak
flows for some days of extreme rainfall and underestimation of base flow, which
Table 2.1 Trend analysis for
precipitation and temperature
Item
Period
Mann-Kendall
Z
P
Precipitation
Annual
À0.91
N
Dry seasonal
0.61
N
Flood seasonal
À1.2
N
Temperature
Annual
3.35
Y
Dry seasonal
1.75
Y
Flood seasonal
3.25
Y
Z is statistics of MKT; Y means significant at the level of P ¼ 0.05
2 Modeling the Effects of Land Use Change and Climate Change on Stream Flow. . .
25