

distribution is: (1) Organic Soil (1.7 %), (2) Coarse Soil (2.4 %), (3) Fine Soil (5.4
%), (4) Brown Forest Soil (72.1 %), (5) Thin Soil (3.2 %), and (6) Undefined Soil
(15.2 %). At the outlet of the basin, there is a monitoring station called Fukakusa
station, which has discharge data of several years from 1991 to 1995 and from 2002
to 2005. The observed discharge data are used to calibrate and validate the model.
The DEM, land use and soil type data were processed in ArcGIS. Based on the
DEM data and hydrological analysis tools of ArcGIS, the basin was divided into
11 sub-basins (Fig. 2.1). Hydrological response units were created by the combination land use and soil type maps using the tool of raster calculation. Figure 2.2c
shows the distribution of HRUs in 2006. There are 18 HRUs in KRB. Each HRU is
named with double-digit. The first digit means land use type and the second digit
means the soil type.
After pre-processing in ArcGIS, the database files were prepared including
meteorological, geographical, hydrological data, etc. And some parameters without
observed data were set manually in general agreement with hydrological knowledge and literature values in the process of calibration and a HYPE project was
built.
2.2.4 Model Calibration
The initial conditions used for the hydrologic models strongly influence the values
of the parameters and predicted outcome (Flu ¨gel 1995; Dixon and Earls. 2012). In
order to reduce the uncertainties over initial conditions, the beginning date of the
simulation in the model is 1978.1.1 under calibration, validation and all scenarios.
The model is calibrated and validated by comparing the simulated stream flow and
observed stream flow on a daily basis for two different 3-year periods. The
calibration period is from 2003.1.1 to 2005.12.31 and the validation period is
from 1993.1.1 to 1995.12.31. Calibration of the model was carried out automatically with an aim of obtaining a good calibration results fit, but with the constraint
that parameters should be in general agreement with hydrological knowledge and
literature values. In these processes, Monte Carlo simulation method is used. The
performance of the calibrated parameters was evaluated by Nash-Sutcliff efficiency
(NSE). The NSE is commonly used in hydrological modeling. It measures the
efficiency of a model by relating the errors to the variance in the observations. A
perfect fit corresponds to NSE ¼ 1, whereas a naive model that uses the mean value
results in NSE ¼ 0. The NSE efficiency is usually evaluated over a certain time
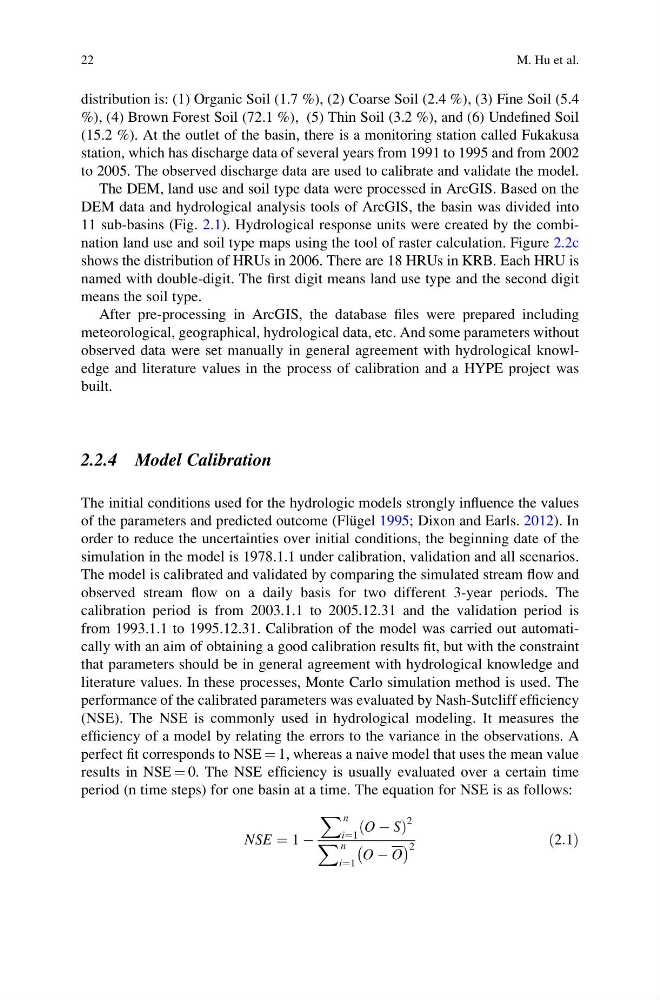
period (n time steps) for one basin at a time. The equation for NSE is as follows:
NSE ¼ 1 À
X n
i¼1
O À S
ð
Þ
2
X n
i¼1
O À O
À
Á 2
ð2:1Þ
22
M. Hu et al.
%), (4) Brown Forest Soil (72.1 %), (5) Thin Soil (3.2 %), and (6) Undefined Soil
(15.2 %). At the outlet of the basin, there is a monitoring station called Fukakusa
station, which has discharge data of several years from 1991 to 1995 and from 2002
to 2005. The observed discharge data are used to calibrate and validate the model.
The DEM, land use and soil type data were processed in ArcGIS. Based on the
DEM data and hydrological analysis tools of ArcGIS, the basin was divided into
11 sub-basins (Fig. 2.1). Hydrological response units were created by the combination land use and soil type maps using the tool of raster calculation. Figure 2.2c
shows the distribution of HRUs in 2006. There are 18 HRUs in KRB. Each HRU is
named with double-digit. The first digit means land use type and the second digit
means the soil type.
After pre-processing in ArcGIS, the database files were prepared including
meteorological, geographical, hydrological data, etc. And some parameters without
observed data were set manually in general agreement with hydrological knowledge and literature values in the process of calibration and a HYPE project was
built.
2.2.4 Model Calibration
The initial conditions used for the hydrologic models strongly influence the values
of the parameters and predicted outcome (Flu ¨gel 1995; Dixon and Earls. 2012). In
order to reduce the uncertainties over initial conditions, the beginning date of the
simulation in the model is 1978.1.1 under calibration, validation and all scenarios.
The model is calibrated and validated by comparing the simulated stream flow and
observed stream flow on a daily basis for two different 3-year periods. The
calibration period is from 2003.1.1 to 2005.12.31 and the validation period is
from 1993.1.1 to 1995.12.31. Calibration of the model was carried out automatically with an aim of obtaining a good calibration results fit, but with the constraint
that parameters should be in general agreement with hydrological knowledge and
literature values. In these processes, Monte Carlo simulation method is used. The
performance of the calibrated parameters was evaluated by Nash-Sutcliff efficiency
(NSE). The NSE is commonly used in hydrological modeling. It measures the
efficiency of a model by relating the errors to the variance in the observations. A
perfect fit corresponds to NSE ¼ 1, whereas a naive model that uses the mean value
results in NSE ¼ 0. The NSE efficiency is usually evaluated over a certain time
period (n time steps) for one basin at a time. The equation for NSE is as follows:
NSE ¼ 1 À
X n
i¼1
O À S
ð
Þ
2
X n
i¼1
O À O
À
Á 2
ð2:1Þ
22
M. Hu et al.