

To further assess the performance of SVM when separating spectrally complex
landscape categories, several sites were selected for a closer look. Figure 13.6
illustrates the original TM image, high resolution image from Google Earth, the
two classified maps from SVM and MLC, for each of the three sites. For the two
spectrally complex categories, namely, low density urban and mixed forest, MLC
tended to include more neighboring pixels into these classes. MLC also
misclassified some evergreen forest patches into water, barren land patches into
high density urban, and grassland patches into low density urban and cropland.
Contrastingly, SVM seemed to have done a better job in mapping spatially scattered
patches. And SVM had correctly classified the residential patches on all the three
sites and the pasture patches on Site 2.
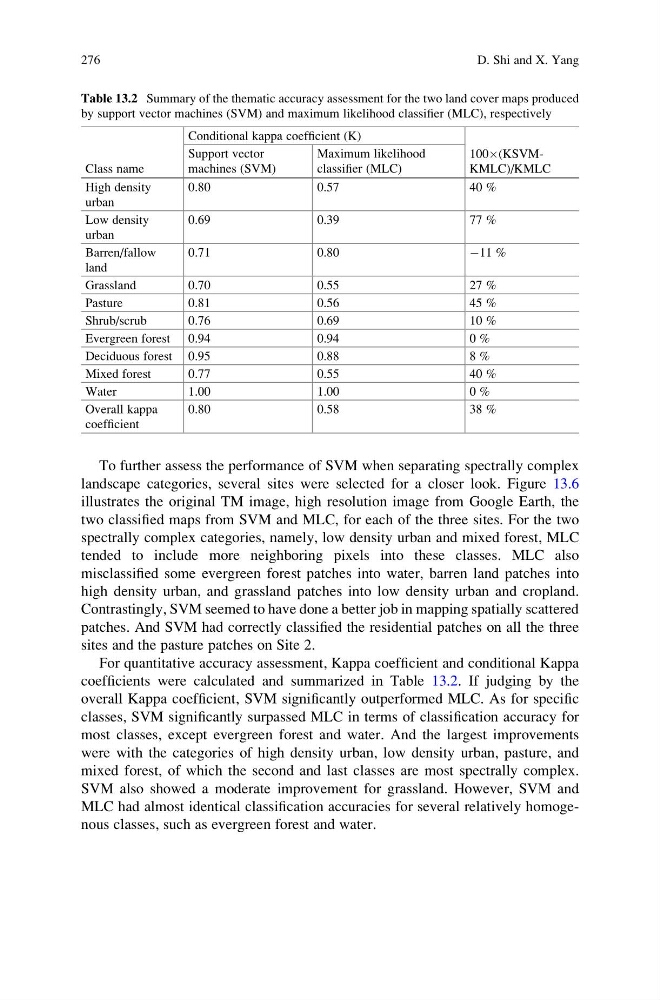
For quantitative accuracy assessment, Kappa coefficient and conditional Kappa
coefficients were calculated and summarized in Table 13.2. If judging by the
overall Kappa coefficient, SVM significantly outperformed MLC. As for specific
classes, SVM significantly surpassed MLC in terms of classification accuracy for
most classes, except evergreen forest and water. And the largest improvements
were with the categories of high density urban, low density urban, pasture, and
mixed forest, of which the second and last classes are most spectrally complex.
SVM also showed a moderate improvement for grassland. However, SVM and
MLC had almost identical classification accuracies for several relatively homogenous classes, such as evergreen forest and water.
Table 13.2 Summary of the thematic accuracy assessment for the two land cover maps produced
by support vector machines (SVM) and maximum likelihood classifier (MLC), respectively
Class name
Conditional kappa coefficient (K)
100Â(KSVMKMLC)/KMLC
Support vector
machines (SVM)
Maximum likelihood
classifier (MLC)
High density
urban
0.80
0.57
40 %
Low density
urban
0.69
0.39
77 %
Barren/fallow
land
0.71
0.80
À11 %
Grassland
0.70
0.55
27 %
Pasture
0.81
0.56
45 %
Shrub/scrub
0.76
0.69
10 %
Evergreen forest 0.94
0.94
0 %
Deciduous forest 0.95
0.88
8 %
Mixed forest
0.77
0.55
40 %
Water
1.00
1.00
0 %
Overall kappa
coefficient
0.80
0.58
38 %
276
D. Shi and X. Yang
landscape categories, several sites were selected for a closer look. Figure 13.6
illustrates the original TM image, high resolution image from Google Earth, the
two classified maps from SVM and MLC, for each of the three sites. For the two
spectrally complex categories, namely, low density urban and mixed forest, MLC
tended to include more neighboring pixels into these classes. MLC also
misclassified some evergreen forest patches into water, barren land patches into
high density urban, and grassland patches into low density urban and cropland.
Contrastingly, SVM seemed to have done a better job in mapping spatially scattered
patches. And SVM had correctly classified the residential patches on all the three
sites and the pasture patches on Site 2.
For quantitative accuracy assessment, Kappa coefficient and conditional Kappa
coefficients were calculated and summarized in Table 13.2. If judging by the
overall Kappa coefficient, SVM significantly outperformed MLC. As for specific
classes, SVM significantly surpassed MLC in terms of classification accuracy for
most classes, except evergreen forest and water. And the largest improvements
were with the categories of high density urban, low density urban, pasture, and
mixed forest, of which the second and last classes are most spectrally complex.
SVM also showed a moderate improvement for grassland. However, SVM and
MLC had almost identical classification accuracies for several relatively homogenous classes, such as evergreen forest and water.
Table 13.2 Summary of the thematic accuracy assessment for the two land cover maps produced
by support vector machines (SVM) and maximum likelihood classifier (MLC), respectively
Class name
Conditional kappa coefficient (K)
100Â(KSVMKMLC)/KMLC
Support vector
machines (SVM)
Maximum likelihood
classifier (MLC)
High density
urban
0.80
0.57
40 %
Low density
urban
0.69
0.39
77 %
Barren/fallow
land
0.71
0.80
À11 %
Grassland
0.70
0.55
27 %
Pasture
0.81
0.56
45 %
Shrub/scrub
0.76
0.69
10 %
Evergreen forest 0.94
0.94
0 %
Deciduous forest 0.95
0.88
8 %
Mixed forest
0.77
0.55
40 %
Water
1.00
1.00
0 %
Overall kappa
coefficient
0.80
0.58
38 %
276
D. Shi and X. Yang