

Fig. 12.6. We assumed that the number of households in each household type in
2050 would change and the ratios to the numbers in 2005 would be as follows: type
1: 2.07, 2: 1.07, 3: 1.39, 4: 0.66, 5: 0.69, 6: 1.32, 7: 0.85 This was estimated by the
log-linear extrapolation of the estimates for 2030 by the National Institute of
Population and Society Research, Japan.
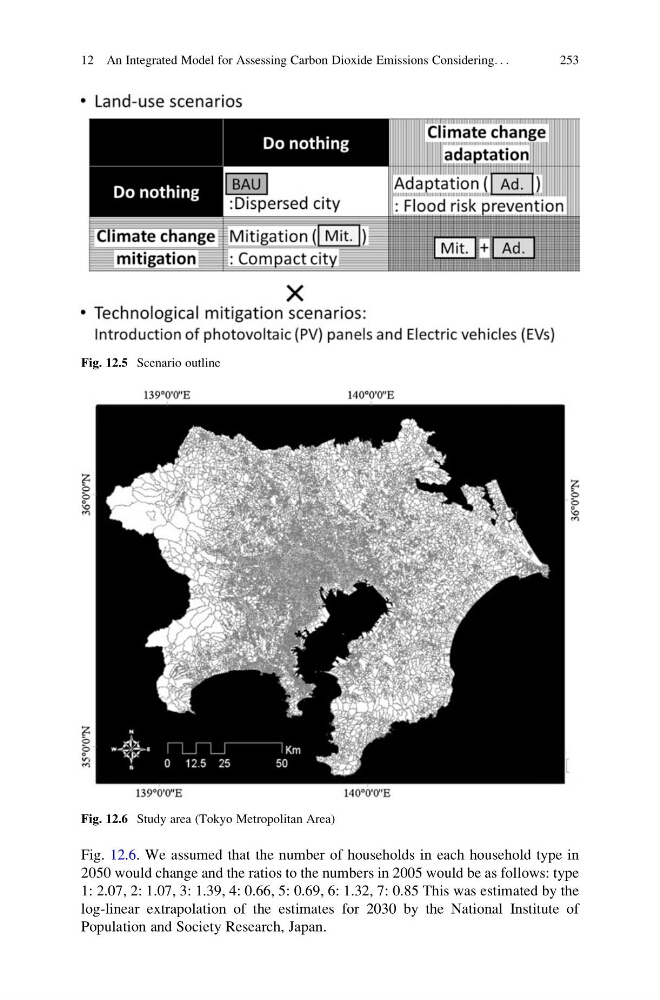
Fig. 12.5 Scenario outline
Fig. 12.6 Study area (Tokyo Metropolitan Area)
12 An Integrated Model for Assessing Carbon Dioxide Emissions Considering. . .
253
2050 would change and the ratios to the numbers in 2005 would be as follows: type
1: 2.07, 2: 1.07, 3: 1.39, 4: 0.66, 5: 0.69, 6: 1.32, 7: 0.85 This was estimated by the
log-linear extrapolation of the estimates for 2030 by the National Institute of
Population and Society Research, Japan.
Fig. 12.5 Scenario outline
Fig. 12.6 Study area (Tokyo Metropolitan Area)
12 An Integrated Model for Assessing Carbon Dioxide Emissions Considering. . .
253