

12.2.1.3 Estimation of Direct/Indirect CO 2 Emissions
For the evaluation of land-use scenarios, we estimated the direct and indirect
emissions on the neighborhood scale. Because urban improvement projects are
implemented on such micro zone scales, the evaluation of the effect on CO 2
emissions should be localized. In order to accurately estimate the lifecycle CO 2
(LC-CO 2 ) related to household consumption, the emission intensity of each consumer goods (expenditure item), such as gasoline, food, etc. must be estimated. The
categories of the items used in this study are shown in Table 12.1. Because emission
intensity differs by region and by consumer (household) type, it is important to
consider its heterogeneity. We employed the algorithm proposed by Tanaka
et al. (2008), who had employed statistical methods (Bayesian estimation method
and Genetic Algorithm) for estimating the emission intensity of each expenditure
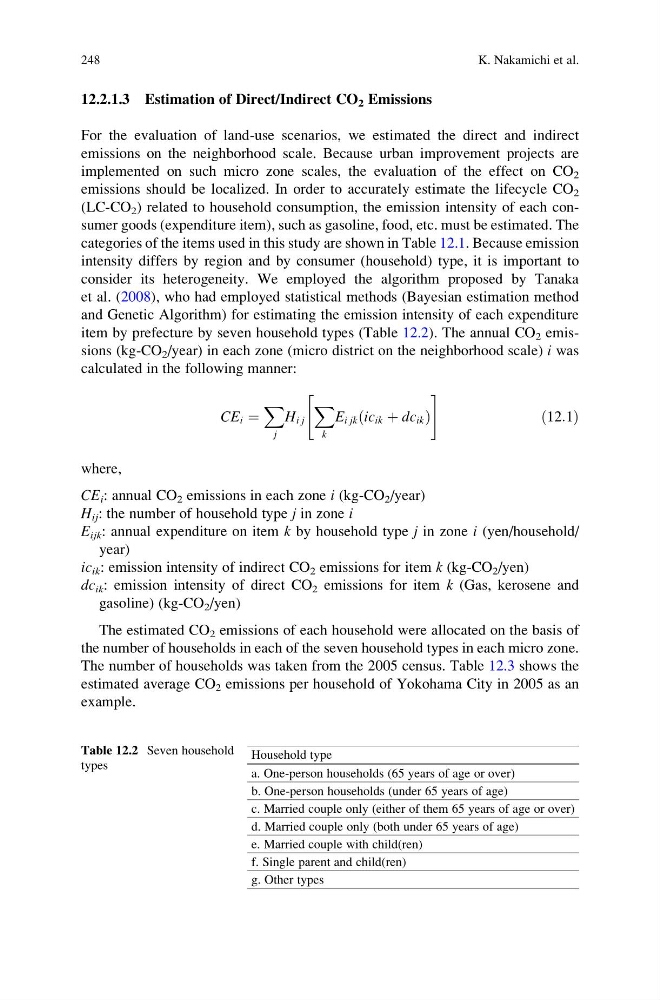
item by prefecture by seven household types (Table 12.2). The annual CO 2 emissions (kg-CO 2 /year) in each zone (micro district on the neighborhood scale) i was
calculated in the following manner:
CE i ¼
X
j
H i j
X
k
E i jk ic ik þ dc ik
ð
Þ
"
#
ð12:1Þ
where,
CE i : annual CO 2 emissions in each zone i (kg-CO 2 /year)
H ij : the number of household type j in zone i
E ijk : annual expenditure on item k by household type j in zone i (yen/household/
year)
ic ik : emission intensity of indirect CO 2 emissions for item k (kg-CO 2 /yen)
dc ik : emission intensity of direct CO 2 emissions for item k (Gas, kerosene and
gasoline) (kg-CO 2 /yen)
The estimated CO 2 emissions of each household were allocated on the basis of
the number of households in each of the seven household types in each micro zone.
The number of households was taken from the 2005 census. Table 12.3 shows the
estimated average CO 2 emissions per household of Yokohama City in 2005 as an
example.
Table 12.2 Seven household
types
Household type
a. One-person households (65 years of age or over)
b. One-person households (under 65 years of age)
c. Married couple only (either of them 65 years of age or over)
d. Married couple only (both under 65 years of age)
e. Married couple with child(ren)
f. Single parent and child(ren)
g. Other types
248
K. Nakamichi et al.
For the evaluation of land-use scenarios, we estimated the direct and indirect
emissions on the neighborhood scale. Because urban improvement projects are
implemented on such micro zone scales, the evaluation of the effect on CO 2
emissions should be localized. In order to accurately estimate the lifecycle CO 2
(LC-CO 2 ) related to household consumption, the emission intensity of each consumer goods (expenditure item), such as gasoline, food, etc. must be estimated. The
categories of the items used in this study are shown in Table 12.1. Because emission
intensity differs by region and by consumer (household) type, it is important to
consider its heterogeneity. We employed the algorithm proposed by Tanaka
et al. (2008), who had employed statistical methods (Bayesian estimation method
and Genetic Algorithm) for estimating the emission intensity of each expenditure
item by prefecture by seven household types (Table 12.2). The annual CO 2 emissions (kg-CO 2 /year) in each zone (micro district on the neighborhood scale) i was
calculated in the following manner:
CE i ¼
X
j
H i j
X
k
E i jk ic ik þ dc ik
ð
Þ
"
#
ð12:1Þ
where,
CE i : annual CO 2 emissions in each zone i (kg-CO 2 /year)
H ij : the number of household type j in zone i
E ijk : annual expenditure on item k by household type j in zone i (yen/household/
year)
ic ik : emission intensity of indirect CO 2 emissions for item k (kg-CO 2 /yen)
dc ik : emission intensity of direct CO 2 emissions for item k (Gas, kerosene and
gasoline) (kg-CO 2 /yen)
The estimated CO 2 emissions of each household were allocated on the basis of
the number of households in each of the seven household types in each micro zone.
The number of households was taken from the 2005 census. Table 12.3 shows the
estimated average CO 2 emissions per household of Yokohama City in 2005 as an
example.
Table 12.2 Seven household
types
Household type
a. One-person households (65 years of age or over)
b. One-person households (under 65 years of age)
c. Married couple only (either of them 65 years of age or over)
d. Married couple only (both under 65 years of age)
e. Married couple with child(ren)
f. Single parent and child(ren)
g. Other types
248
K. Nakamichi et al.