

For calculating the annual expenditure on each item, we employed the Household Expenditure Survey (HES). This is a survey conducted to investigate the actual
state of household incomes and expenditures in terms of expenditure and consumption. We used the data collected in 2005 as the base year. This survey is performed
every month for 981 consumption items for 8,000 households in 168 villages, towns
and cities all over Japan by the Statistics Bureau, Ministry of Internal Affairs and
Communications. The results of the survey are announced monthly and yearly for
cities, regions, types of households (i.e. total number of households, households of
more than two, single person households). In order to estimate CO 2 emissions from
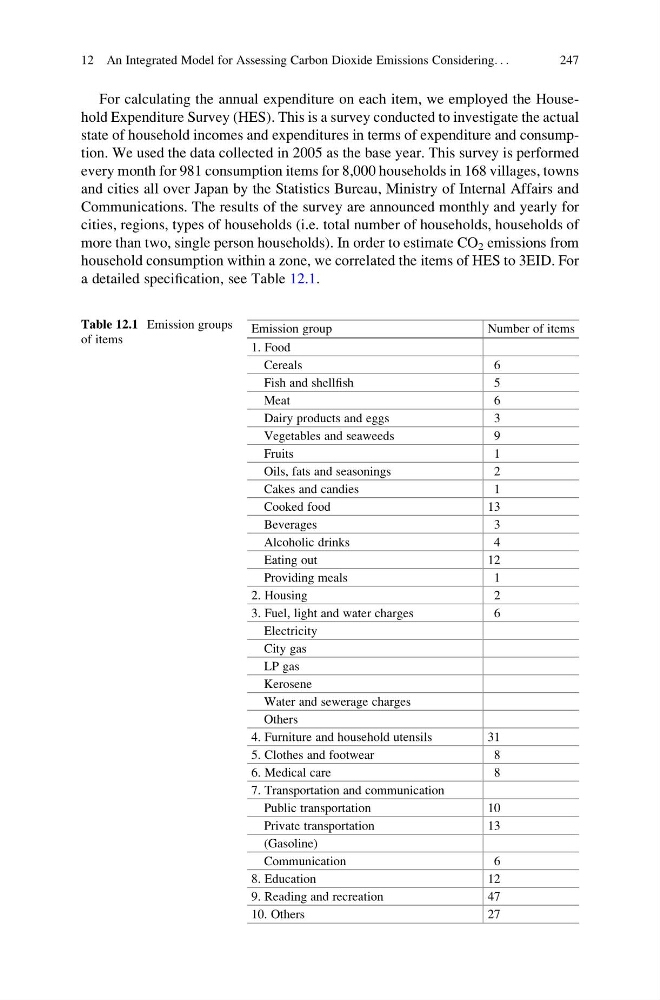
household consumption within a zone, we correlated the items of HES to 3EID. For
a detailed specification, see Table 12.1.
Table 12.1 Emission groups
of items
Emission group
Number of items
1. Food
Cereals
6
Fish and shellfish
5
Meat
6
Dairy products and eggs
3
Vegetables and seaweeds
9
Fruits
1
Oils, fats and seasonings
2
Cakes and candies
1
Cooked food
13
Beverages
3
Alcoholic drinks
4
Eating out
12
Providing meals
1
2. Housing
2
3. Fuel, light and water charges
6
Electricity
City gas
LP gas
Kerosene
Water and sewerage charges
Others
4. Furniture and household utensils
31
5. Clothes and footwear
8
6. Medical care
8
7. Transportation and communication
Public transportation
10
Private transportation
13
(Gasoline)
Communication
6
8. Education
12
9. Reading and recreation
47
10. Others
27
12 An Integrated Model for Assessing Carbon Dioxide Emissions Considering. . .
247
state of household incomes and expenditures in terms of expenditure and consumption. We used the data collected in 2005 as the base year. This survey is performed
every month for 981 consumption items for 8,000 households in 168 villages, towns
and cities all over Japan by the Statistics Bureau, Ministry of Internal Affairs and
Communications. The results of the survey are announced monthly and yearly for
cities, regions, types of households (i.e. total number of households, households of
more than two, single person households). In order to estimate CO 2 emissions from
household consumption within a zone, we correlated the items of HES to 3EID. For
a detailed specification, see Table 12.1.
Table 12.1 Emission groups
of items
Emission group
Number of items
1. Food
Cereals
6
Fish and shellfish
5
Meat
6
Dairy products and eggs
3
Vegetables and seaweeds
9
Fruits
1
Oils, fats and seasonings
2
Cakes and candies
1
Cooked food
13
Beverages
3
Alcoholic drinks
4
Eating out
12
Providing meals
1
2. Housing
2
3. Fuel, light and water charges
6
Electricity
City gas
LP gas
Kerosene
Water and sewerage charges
Others
4. Furniture and household utensils
31
5. Clothes and footwear
8
6. Medical care
8
7. Transportation and communication
Public transportation
10
Private transportation
13
(Gasoline)
Communication
6
8. Education
12
9. Reading and recreation
47
10. Others
27
12 An Integrated Model for Assessing Carbon Dioxide Emissions Considering. . .
247