

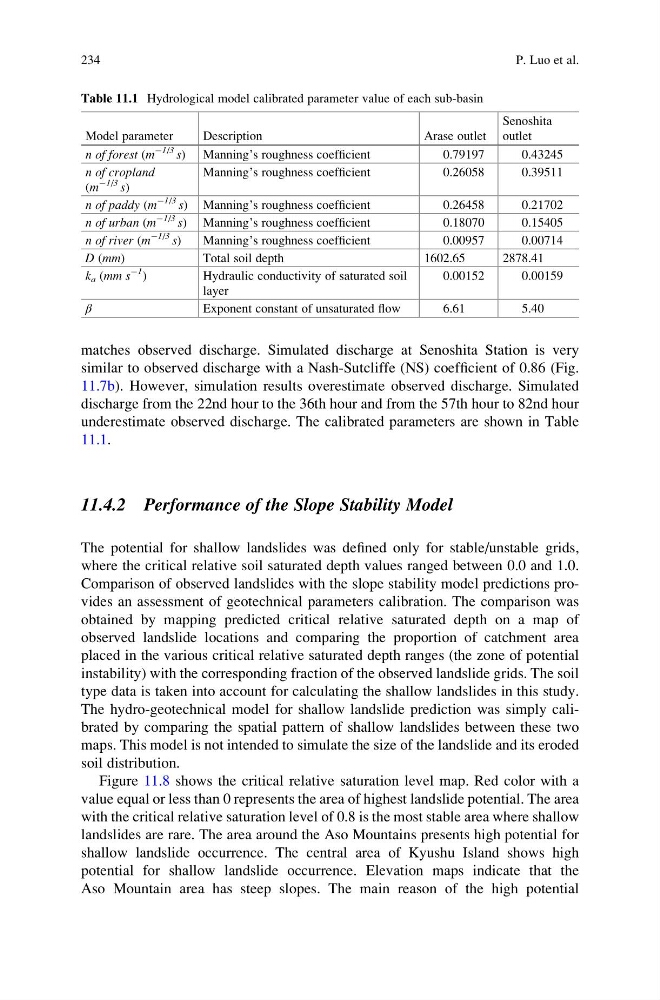
matches observed discharge. Simulated discharge at Senoshita Station is very
similar to observed discharge with a Nash-Sutcliffe (NS) coefficient of 0.86 (Fig.
11.7b). However, simulation results overestimate observed discharge. Simulated
discharge from the 22nd hour to the 36th hour and from the 57th hour to 82nd hour
underestimate observed discharge. The calibrated parameters are shown in Table
11.1.
11.4.2 Performance of the Slope Stability Model
The potential for shallow landslides was defined only for stable/unstable grids,
where the critical relative soil saturated depth values ranged between 0.0 and 1.0.
Comparison of observed landslides with the slope stability model predictions provides an assessment of geotechnical parameters calibration. The comparison was
obtained by mapping predicted critical relative saturated depth on a map of
observed landslide locations and comparing the proportion of catchment area
placed in the various critical relative saturated depth ranges (the zone of potential
instability) with the corresponding fraction of the observed landslide grids. The soil
type data is taken into account for calculating the shallow landslides in this study.
The hydro-geotechnical model for shallow landslide prediction was simply calibrated by comparing the spatial pattern of shallow landslides between these two
maps. This model is not intended to simulate the size of the landslide and its eroded
soil distribution.
Figure 11.8 shows the critical relative saturation level map. Red color with a
value equal or less than 0 represents the area of highest landslide potential. The area
with the critical relative saturation level of 0.8 is the most stable area where shallow
landslides are rare. The area around the Aso Mountains presents high potential for
shallow landslide occurrence. The central area of Kyushu Island shows high
potential for shallow landslide occurrence. Elevation maps indicate that the
Aso Mountain area has steep slopes. The main reason of the high potential
Table 11.1 Hydrological model calibrated parameter value of each sub-basin
Model parameter
Description
Arase outlet
Senoshita
outlet
n of forest (m
À1/3 s) Manning’s roughness coefficient
0.79197
0.43245
n of cropland
(m
À1/3 s)
Manning’s roughness coefficient
0.26058
0.39511
n of paddy (m
À1/3 s) Manning’s roughness coefficient
0.26458
0.21702
n of urban (m
À1/3 s) Manning’s roughness coefficient
0.18070
0.15405
n of river (m
À1/3 s)
Manning’s roughness coefficient
0.00957
0.00714
D (mm)
Total soil depth
1602.65
2878.41
k a (mm s
À1
)
Hydraulic conductivity of saturated soil
layer
0.00152
0.00159
β
Exponent constant of unsaturated flow
6.61
5.40
234
P. Luo et al.
similar to observed discharge with a Nash-Sutcliffe (NS) coefficient of 0.86 (Fig.
11.7b). However, simulation results overestimate observed discharge. Simulated
discharge from the 22nd hour to the 36th hour and from the 57th hour to 82nd hour
underestimate observed discharge. The calibrated parameters are shown in Table
11.1.
11.4.2 Performance of the Slope Stability Model
The potential for shallow landslides was defined only for stable/unstable grids,
where the critical relative soil saturated depth values ranged between 0.0 and 1.0.
Comparison of observed landslides with the slope stability model predictions provides an assessment of geotechnical parameters calibration. The comparison was
obtained by mapping predicted critical relative saturated depth on a map of
observed landslide locations and comparing the proportion of catchment area
placed in the various critical relative saturated depth ranges (the zone of potential
instability) with the corresponding fraction of the observed landslide grids. The soil
type data is taken into account for calculating the shallow landslides in this study.
The hydro-geotechnical model for shallow landslide prediction was simply calibrated by comparing the spatial pattern of shallow landslides between these two
maps. This model is not intended to simulate the size of the landslide and its eroded
soil distribution.
Figure 11.8 shows the critical relative saturation level map. Red color with a
value equal or less than 0 represents the area of highest landslide potential. The area
with the critical relative saturation level of 0.8 is the most stable area where shallow
landslides are rare. The area around the Aso Mountains presents high potential for
shallow landslide occurrence. The central area of Kyushu Island shows high
potential for shallow landslide occurrence. Elevation maps indicate that the
Aso Mountain area has steep slopes. The main reason of the high potential
Table 11.1 Hydrological model calibrated parameter value of each sub-basin
Model parameter
Description
Arase outlet
Senoshita
outlet
n of forest (m
À1/3 s) Manning’s roughness coefficient
0.79197
0.43245
n of cropland
(m
À1/3 s)
Manning’s roughness coefficient
0.26058
0.39511
n of paddy (m
À1/3 s) Manning’s roughness coefficient
0.26458
0.21702
n of urban (m
À1/3 s) Manning’s roughness coefficient
0.18070
0.15405
n of river (m
À1/3 s)
Manning’s roughness coefficient
0.00957
0.00714
D (mm)
Total soil depth
1602.65
2878.41
k a (mm s
À1
)
Hydraulic conductivity of saturated soil
layer
0.00152
0.00159
β
Exponent constant of unsaturated flow
6.61
5.40
234
P. Luo et al.