

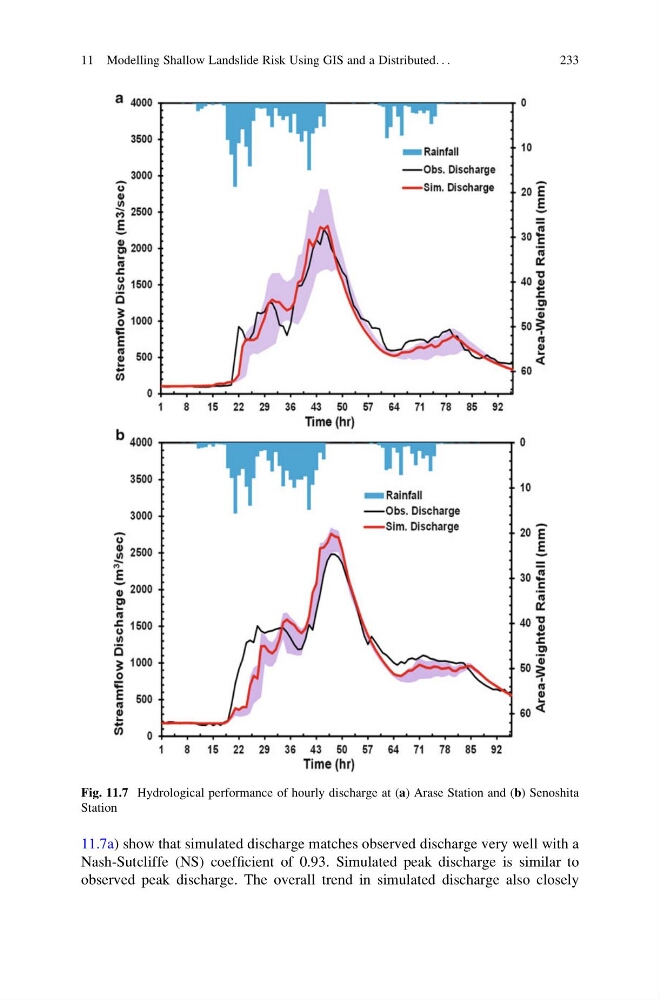
11.7a) show that simulated discharge matches observed discharge very well with a
Nash-Sutcliffe (NS) coefficient of 0.93. Simulated peak discharge is similar to
observed peak discharge. The overall trend in simulated discharge also closely
Fig. 11.7 Hydrological performance of hourly discharge at (a) Arase Station and (b) Senoshita
Station
11 Modelling Shallow Landslide Risk Using GIS and a Distributed. . .
233
Nash-Sutcliffe (NS) coefficient of 0.93. Simulated peak discharge is similar to
observed peak discharge. The overall trend in simulated discharge also closely
Fig. 11.7 Hydrological performance of hourly discharge at (a) Arase Station and (b) Senoshita
Station
11 Modelling Shallow Landslide Risk Using GIS and a Distributed. . .
233