

10.5.3 Vulnerability Map of the Coastal Erosion
Vulnerability was ranked by six levels as follows; (1) 0–4, (2) 5–9, (3) 10–14,
(4) 15–19, (5) 20–24, and (6) 25–27. The total number of meshes was 686. The
numbers and percentage of meshes of each vulnerability were as follows: vulnerability 1 had 332 meshes (48.4 %), 2 had 124 meshes (18.1 %), 3 had 88 meshes
(12.8 %), 4 had 59 meshes (8.6 %), 5 had 70 meshes (10.2 %), 6 had 13 meshes
(1.9 %). The average vulnerability was 2.2 and standard error was 0.46.
The land use vulnerability map indicated that the coastal erosion risk from the
aspect of land use was highest at the Van Ly area and the village in Hoang Hoa. The
coastal erosion risk of rice paddies was highest in the coastal area of Giao Thuy and
inland area of Van Ly.
There were rush fields in the inland area of Nghia Hung and Kim Son which was
the deposition area. These rush fields could be considered to be of low vulnerability
to the threat of coastal erosion (Fig. 10.8).
10.6 Conclusions
In this study, making a risk map for coastal erosion was accomplished through the
use of UPGMA cluster analysis of the fragmentary data in the Red River Delta,
Vietnam. Not only in Vietnam, but also in other developing countries, the necessary
data are almost always lacking. Under these circumstances, satellite remote sensor
data can be quite useful. Coastline changes can be assessed by using satellite remote
sensor data. This study could be employed to make a vulnerability map, including
land use, banks and salinity, by using the UPGMA cluster analysis. The Coastal
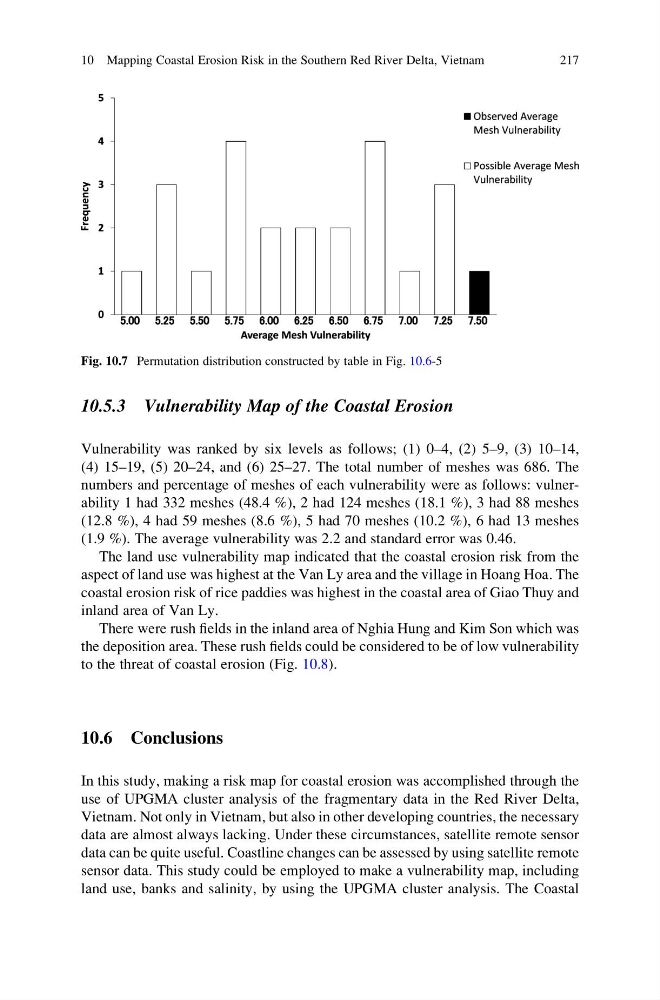
Fig. 10.7 Permutation distribution constructed by table in Fig. 10.6-5
10 Mapping Coastal Erosion Risk in the Southern Red River Delta, Vietnam
217
Vulnerability was ranked by six levels as follows; (1) 0–4, (2) 5–9, (3) 10–14,
(4) 15–19, (5) 20–24, and (6) 25–27. The total number of meshes was 686. The
numbers and percentage of meshes of each vulnerability were as follows: vulnerability 1 had 332 meshes (48.4 %), 2 had 124 meshes (18.1 %), 3 had 88 meshes
(12.8 %), 4 had 59 meshes (8.6 %), 5 had 70 meshes (10.2 %), 6 had 13 meshes
(1.9 %). The average vulnerability was 2.2 and standard error was 0.46.
The land use vulnerability map indicated that the coastal erosion risk from the
aspect of land use was highest at the Van Ly area and the village in Hoang Hoa. The
coastal erosion risk of rice paddies was highest in the coastal area of Giao Thuy and
inland area of Van Ly.
There were rush fields in the inland area of Nghia Hung and Kim Son which was
the deposition area. These rush fields could be considered to be of low vulnerability
to the threat of coastal erosion (Fig. 10.8).
10.6 Conclusions
In this study, making a risk map for coastal erosion was accomplished through the
use of UPGMA cluster analysis of the fragmentary data in the Red River Delta,
Vietnam. Not only in Vietnam, but also in other developing countries, the necessary
data are almost always lacking. Under these circumstances, satellite remote sensor
data can be quite useful. Coastline changes can be assessed by using satellite remote
sensor data. This study could be employed to make a vulnerability map, including
land use, banks and salinity, by using the UPGMA cluster analysis. The Coastal
Fig. 10.7 Permutation distribution constructed by table in Fig. 10.6-5
10 Mapping Coastal Erosion Risk in the Southern Red River Delta, Vietnam
217