

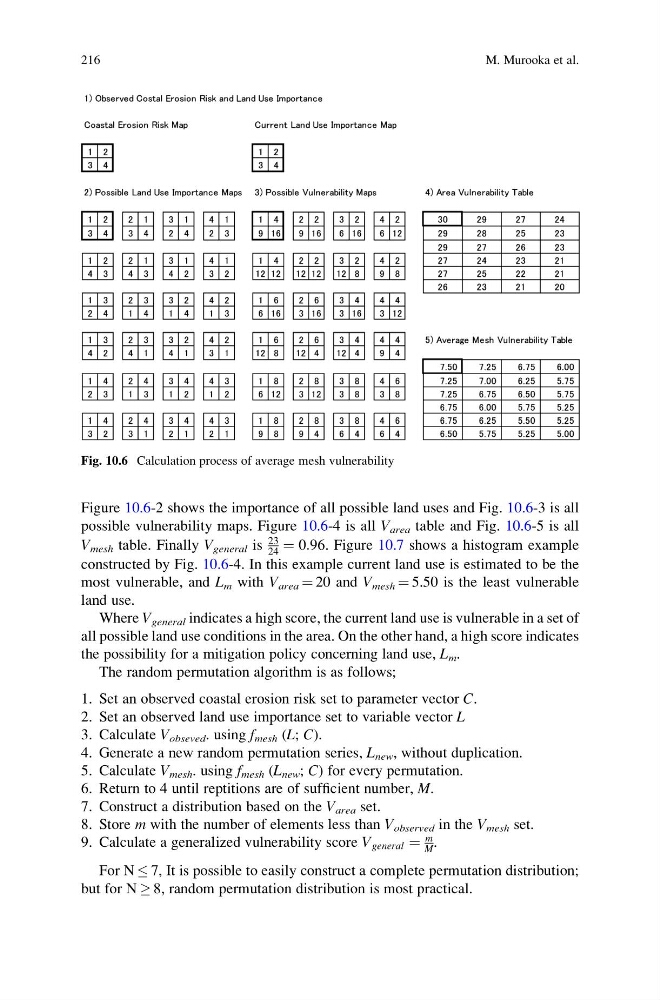
Figure 10.6-2 shows the importance of all possible land uses and Fig. 10.6-3 is all
possible vulnerability maps. Figure 10.6-4 is all V area table and Fig. 10.6-5 is all
V mesh table. Finally V general is
23
24 ¼ 0:96. Figure 10.7 shows a histogram example
constructed by Fig. 10.6-4. In this example current land use is estimated to be the
most vulnerable, and L m with V area ¼ 20 and V mesh ¼ 5.50 is the least vulnerable
land use.
Where V general indicates a high score, the current land use is vulnerable in a set of
all possible land use conditions in the area. On the other hand, a high score indicates
the possibility for a mitigation policy concerning land use, L m .
The random permutation algorithm is as follows;
1. Set an observed coastal erosion risk set to parameter vector C.
2. Set an observed land use importance set to variable vector L
3. Calculate V obseved . using f mesh (L; C).
4. Generate a new random permutation series, L new , without duplication.
5. Calculate V mesh . using f mesh (L new ; C) for every permutation.
6. Return to 4 until reptitions are of sufficient number, M.
7. Construct a distribution based on the V area set.
8. Store m with the number of elements less than V observed in the V mesh set.
9. Calculate a generalized vulnerability score V general ¼
m
M .
For N 7, It is possible to easily construct a complete permutation distribution;
but for N ! 8, random permutation distribution is most practical.
Fig. 10.6 Calculation process of average mesh vulnerability
216
M. Murooka et al.
possible vulnerability maps. Figure 10.6-4 is all V area table and Fig. 10.6-5 is all
V mesh table. Finally V general is
23
24 ¼ 0:96. Figure 10.7 shows a histogram example
constructed by Fig. 10.6-4. In this example current land use is estimated to be the
most vulnerable, and L m with V area ¼ 20 and V mesh ¼ 5.50 is the least vulnerable
land use.
Where V general indicates a high score, the current land use is vulnerable in a set of
all possible land use conditions in the area. On the other hand, a high score indicates
the possibility for a mitigation policy concerning land use, L m .
The random permutation algorithm is as follows;
1. Set an observed coastal erosion risk set to parameter vector C.
2. Set an observed land use importance set to variable vector L
3. Calculate V obseved . using f mesh (L; C).
4. Generate a new random permutation series, L new , without duplication.
5. Calculate V mesh . using f mesh (L new ; C) for every permutation.
6. Return to 4 until reptitions are of sufficient number, M.
7. Construct a distribution based on the V area set.
8. Store m with the number of elements less than V observed in the V mesh set.
9. Calculate a generalized vulnerability score V general ¼
m
M .
For N 7, It is possible to easily construct a complete permutation distribution;
but for N ! 8, random permutation distribution is most practical.
Fig. 10.6 Calculation process of average mesh vulnerability
216
M. Murooka et al.