

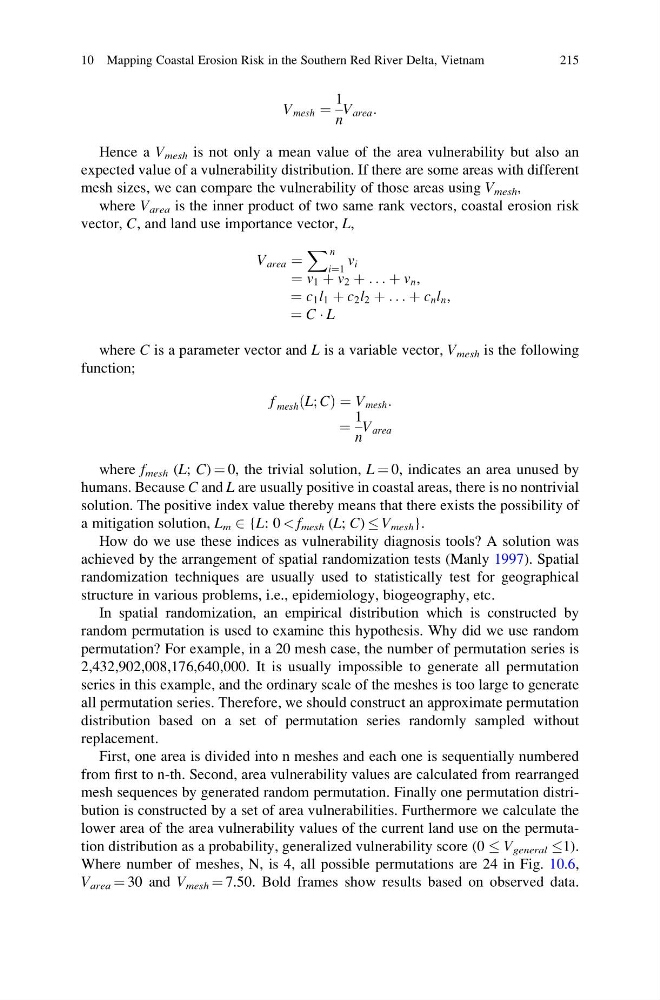
V mesh ¼
1
n
V area :
Hence a V mesh is not only a mean value of the area vulnerability but also an
expected value of a vulnerability distribution. If there are some areas with different
mesh sizes, we can compare the vulnerability of those areas using V mesh ,
where V area is the inner product of two same rank vectors, coastal erosion risk
vector, C, and land use importance vector, L,
V area ¼
X n
i¼1
v i
¼ v 1 þ v 2 þ . . . þ v n ,
¼ c 1 l 1 þ c 2 l 2 þ . . . þ c n l n ,
¼ C Á L
where C is a parameter vector and L is a variable vector, V mesh is the following
function;
f mesh L; C
ð
Þ ¼ V mesh :
¼
1
n
V area
where f mesh (L; C) ¼ 0, the trivial solution, L ¼ 0, indicates an area unused by
humans. Because C and L are usually positive in coastal areas, there is no nontrivial
solution. The positive index value thereby means that there exists the possibility of
a mitigation solution, L m 2 {L: 0 < f mesh (L; C) V mesh }.
How do we use these indices as vulnerability diagnosis tools? A solution was
achieved by the arrangement of spatial randomization tests (Manly 1997). Spatial
randomization techniques are usually used to statistically test for geographical
structure in various problems, i.e., epidemiology, biogeography, etc.
In spatial randomization, an empirical distribution which is constructed by
random permutation is used to examine this hypothesis. Why did we use random
permutation? For example, in a 20 mesh case, the number of permutation series is
2,432,902,008,176,640,000. It is usually impossible to generate all permutation
series in this example, and the ordinary scale of the meshes is too large to generate
all permutation series. Therefore, we should construct an approximate permutation
distribution based on a set of permutation series randomly sampled without
replacement.
First, one area is divided into n meshes and each one is sequentially numbered
from first to n-th. Second, area vulnerability values are calculated from rearranged
mesh sequences by generated random permutation. Finally one permutation distribution is constructed by a set of area vulnerabilities. Furthermore we calculate the
lower area of the area vulnerability values of the current land use on the permutation distribution as a probability, generalized vulnerability score (0 V general 1).
Where number of meshes, N, is 4, all possible permutations are 24 in Fig. 10.6,
V area ¼ 30 and V mesh ¼ 7.50. Bold frames show results based on observed data.
10 Mapping Coastal Erosion Risk in the Southern Red River Delta, Vietnam
215
1
n
V area :
Hence a V mesh is not only a mean value of the area vulnerability but also an
expected value of a vulnerability distribution. If there are some areas with different
mesh sizes, we can compare the vulnerability of those areas using V mesh ,
where V area is the inner product of two same rank vectors, coastal erosion risk
vector, C, and land use importance vector, L,
V area ¼
X n
i¼1
v i
¼ v 1 þ v 2 þ . . . þ v n ,
¼ c 1 l 1 þ c 2 l 2 þ . . . þ c n l n ,
¼ C Á L
where C is a parameter vector and L is a variable vector, V mesh is the following
function;
f mesh L; C
ð
Þ ¼ V mesh :
¼
1
n
V area
where f mesh (L; C) ¼ 0, the trivial solution, L ¼ 0, indicates an area unused by
humans. Because C and L are usually positive in coastal areas, there is no nontrivial
solution. The positive index value thereby means that there exists the possibility of
a mitigation solution, L m 2 {L: 0 < f mesh (L; C) V mesh }.
How do we use these indices as vulnerability diagnosis tools? A solution was
achieved by the arrangement of spatial randomization tests (Manly 1997). Spatial
randomization techniques are usually used to statistically test for geographical
structure in various problems, i.e., epidemiology, biogeography, etc.
In spatial randomization, an empirical distribution which is constructed by
random permutation is used to examine this hypothesis. Why did we use random
permutation? For example, in a 20 mesh case, the number of permutation series is
2,432,902,008,176,640,000. It is usually impossible to generate all permutation
series in this example, and the ordinary scale of the meshes is too large to generate
all permutation series. Therefore, we should construct an approximate permutation
distribution based on a set of permutation series randomly sampled without
replacement.
First, one area is divided into n meshes and each one is sequentially numbered
from first to n-th. Second, area vulnerability values are calculated from rearranged
mesh sequences by generated random permutation. Finally one permutation distribution is constructed by a set of area vulnerabilities. Furthermore we calculate the
lower area of the area vulnerability values of the current land use on the permutation distribution as a probability, generalized vulnerability score (0 V general 1).
Where number of meshes, N, is 4, all possible permutations are 24 in Fig. 10.6,
V area ¼ 30 and V mesh ¼ 7.50. Bold frames show results based on observed data.
10 Mapping Coastal Erosion Risk in the Southern Red River Delta, Vietnam
215