

10.5.2 Vulnerability Diagnosis: Spatial Randomization
for Current Land Use
Is current land use in the southern Red River Delta vulnerable? Because of the
importance of the problem, we introduce a vulnerability index (Murooka and
Haruyama 2005).
Where one study area is divided into n meshes, the vulnerability of i-th mesh, ν i ,
is a product of coastal erosion risk and land use importance,
v i ¼ c i l i ;
c i : coastal erosion risk of i-th mesh, l i : land use importance of i-th mesh.
ν i is the original vulnerability index.
Where an area vulnerability is defined as a total sum of all vulnerabilities,
V area ¼
X n
i¼1
v i :
V area is a unique measurement based on observation. Furthermore an average
mesh vulnerability is
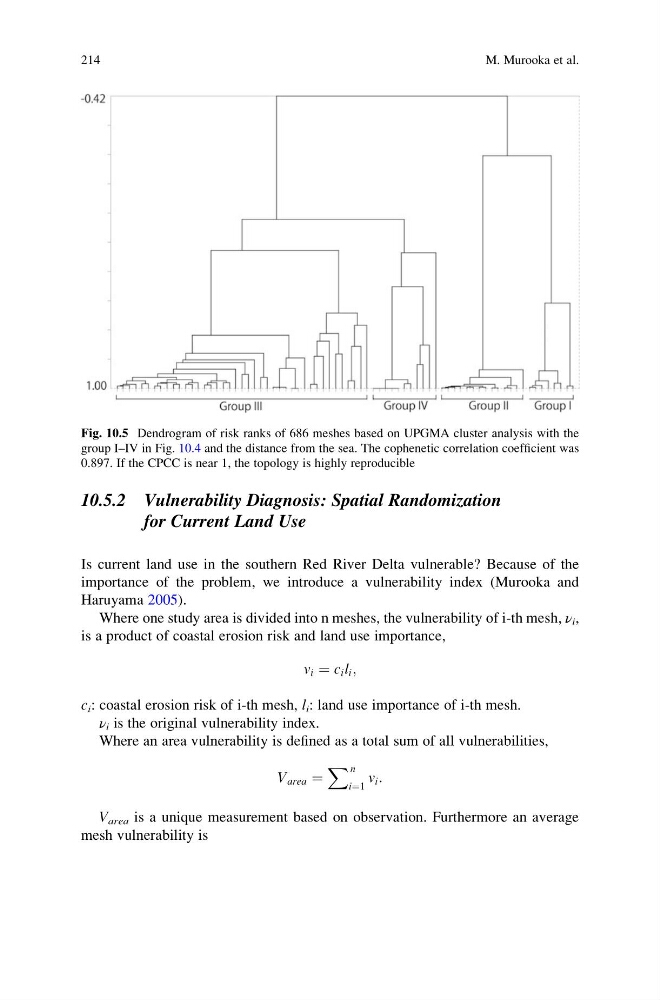
Fig. 10.5 Dendrogram of risk ranks of 686 meshes based on UPGMA cluster analysis with the
group I–IV in Fig. 10.4 and the distance from the sea. The cophenetic correlation coefficient was
0.897. If the CPCC is near 1, the topology is highly reproducible
214
M. Murooka et al.
for Current Land Use
Is current land use in the southern Red River Delta vulnerable? Because of the
importance of the problem, we introduce a vulnerability index (Murooka and
Haruyama 2005).
Where one study area is divided into n meshes, the vulnerability of i-th mesh, ν i ,
is a product of coastal erosion risk and land use importance,
v i ¼ c i l i ;
c i : coastal erosion risk of i-th mesh, l i : land use importance of i-th mesh.
ν i is the original vulnerability index.
Where an area vulnerability is defined as a total sum of all vulnerabilities,
V area ¼
X n
i¼1
v i :
V area is a unique measurement based on observation. Furthermore an average
mesh vulnerability is
Fig. 10.5 Dendrogram of risk ranks of 686 meshes based on UPGMA cluster analysis with the
group I–IV in Fig. 10.4 and the distance from the sea. The cophenetic correlation coefficient was
0.897. If the CPCC is near 1, the topology is highly reproducible
214
M. Murooka et al.