

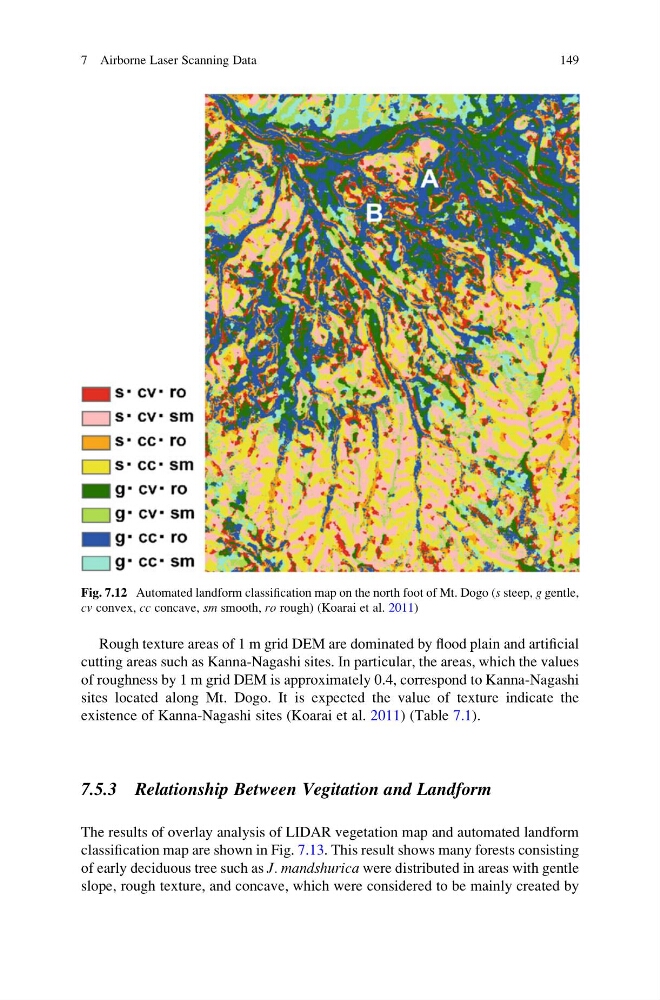
Rough texture areas of 1 m grid DEM are dominated by flood plain and artificial
cutting areas such as Kanna-Nagashi sites. In particular, the areas, which the values
of roughness by 1 m grid DEM is approximately 0.4, correspond to Kanna-Nagashi
sites located along Mt. Dogo. It is expected the value of texture indicate the
existence of Kanna-Nagashi sites (Koarai et al. 2011) (Table 7.1).
7.5.3 Relationship Between Vegitation and Landform
The results of overlay analysis of LIDAR vegetation map and automated landform
classification map are shown in Fig. 7.13. This result shows many forests consisting
of early deciduous tree such as J. mandshurica were distributed in areas with gentle
slope, rough texture, and concave, which were considered to be mainly created by
Fig. 7.12 Automated landform classification map on the north foot of Mt. Dogo (s steep, g gentle,
cv convex, cc concave, sm smooth, ro rough) (Koarai et al. 2011)
7 Airborne Laser Scanning Data
149
cutting areas such as Kanna-Nagashi sites. In particular, the areas, which the values
of roughness by 1 m grid DEM is approximately 0.4, correspond to Kanna-Nagashi
sites located along Mt. Dogo. It is expected the value of texture indicate the
existence of Kanna-Nagashi sites (Koarai et al. 2011) (Table 7.1).
7.5.3 Relationship Between Vegitation and Landform
The results of overlay analysis of LIDAR vegetation map and automated landform
classification map are shown in Fig. 7.13. This result shows many forests consisting
of early deciduous tree such as J. mandshurica were distributed in areas with gentle
slope, rough texture, and concave, which were considered to be mainly created by
Fig. 7.12 Automated landform classification map on the north foot of Mt. Dogo (s steep, g gentle,
cv convex, cc concave, sm smooth, ro rough) (Koarai et al. 2011)
7 Airborne Laser Scanning Data
149