

deciduous multiple layer trees, because there are small evergreen trees under
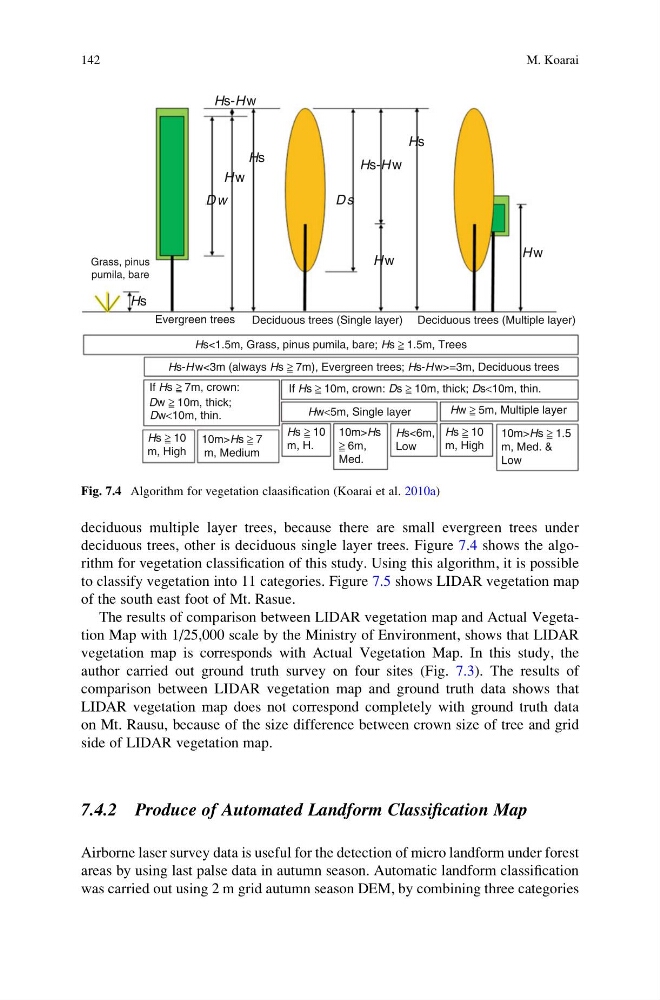
deciduous trees, other is deciduous single layer trees. Figure 7.4 shows the algorithm for vegetation classification of this study. Using this algorithm, it is possible
to classify vegetation into 11 categories. Figure 7.5 shows LIDAR vegetation map
of the south east foot of Mt. Rasue.
The results of comparison between LIDAR vegetation map and Actual Vegetation Map with 1/25,000 scale by the Ministry of Environment, shows that LIDAR
vegetation map is corresponds with Actual Vegetation Map. In this study, the
author carried out ground truth survey on four sites (Fig. 7.3). The results of
comparison between LIDAR vegetation map and ground truth data shows that
LIDAR vegetation map does not correspond completely with ground truth data
on Mt. Rausu, because of the size difference between crown size of tree and grid
side of LIDAR vegetation map.
7.4.2 Produce of Automated Landform Classification Map
Airborne laser survey data is useful for the detection of micro landform under forest
areas by using last palse data in autumn season. Automatic landform classification
was carried out using 2 m grid autumn season DEM, by combining three categories
Hs-H w
Hs-H w
Hs-H w<3m (always Hs ≥ 7m), Evergreen trees; Hs-H w>=3m, Deciduous trees
H w
H w
H w
D w
D s
Hs
Hs
Hs<1.5m, Grass, pinus pumila, bare; Hs ≥ 1.5m, Trees
If Hs ≥ 7m, crown:
If Hs ≥ 10m, crown: Ds ≥ 10m, thick; Ds<10m, thin.
Hw<5m, Single layer
Hw ≥ 5m, Multiple layer
Hs ≥ 10
m, High
Hs ≥ 10
m, H.
Hs ≥ 10
m, High
10m>Hs ≥ 7
m, Medium
Hs<6m,
Low
10m>Hs ≥ 1.5
m, Med. &
Low
10m>Hs
≥ 6m,
Med.
Dw ≥ 10m, thick;
Dw<10m, thin.
Hs
Grass, pinus
pumila, bare
Evergreen trees Deciduous trees (Single layer) Deciduous trees (Multiple layer)
Fig. 7.4 Algorithm for vegetation claasification (Koarai et al. 2010a)
142
M. Koarai
deciduous trees, other is deciduous single layer trees. Figure 7.4 shows the algorithm for vegetation classification of this study. Using this algorithm, it is possible
to classify vegetation into 11 categories. Figure 7.5 shows LIDAR vegetation map
of the south east foot of Mt. Rasue.
The results of comparison between LIDAR vegetation map and Actual Vegetation Map with 1/25,000 scale by the Ministry of Environment, shows that LIDAR
vegetation map is corresponds with Actual Vegetation Map. In this study, the
author carried out ground truth survey on four sites (Fig. 7.3). The results of
comparison between LIDAR vegetation map and ground truth data shows that
LIDAR vegetation map does not correspond completely with ground truth data
on Mt. Rausu, because of the size difference between crown size of tree and grid
side of LIDAR vegetation map.
7.4.2 Produce of Automated Landform Classification Map
Airborne laser survey data is useful for the detection of micro landform under forest
areas by using last palse data in autumn season. Automatic landform classification
was carried out using 2 m grid autumn season DEM, by combining three categories
Hs-H w
Hs-H w
Hs-H w<3m (always Hs ≥ 7m), Evergreen trees; Hs-H w>=3m, Deciduous trees
H w
H w
H w
D w
D s
Hs
Hs
Hs<1.5m, Grass, pinus pumila, bare; Hs ≥ 1.5m, Trees
If Hs ≥ 7m, crown:
If Hs ≥ 10m, crown: Ds ≥ 10m, thick; Ds<10m, thin.
Hw<5m, Single layer
Hw ≥ 5m, Multiple layer
Hs ≥ 10
m, High
Hs ≥ 10
m, H.
Hs ≥ 10
m, High
10m>Hs ≥ 7
m, Medium
Hs<6m,
Low
10m>Hs ≥ 1.5
m, Med. &
Low
10m>Hs
≥ 6m,
Med.
Dw ≥ 10m, thick;
Dw<10m, thin.
Hs
Grass, pinus
pumila, bare
Evergreen trees Deciduous trees (Single layer) Deciduous trees (Multiple layer)
Fig. 7.4 Algorithm for vegetation claasification (Koarai et al. 2010a)
142
M. Koarai