

7.4.1 Produce of LIDAR Vegitation Map
Vegetation classification has been carried out using three dimensional vegetation
structure detected by the difference between DSM data during the two seasons. The
algorithm of producing LIDAR vegetation map (three dimensional vegetation
structure map) is as follows (Koarai et al. 2010a). The legend of LIDAR vegetation
map consists of the combination of vegetation height, thickness of crown and
differences between the two seasons (deciduous single layer tree, deciduous multiple layer tree and evergreen tree). Vegetation height of each grid is calculated by
differences between DSM and DEM. As the result of overlay analysis between
vegetation height by LIDAR and Actual Vegetation Map with 1/25,000 scale by the
Ministry of Environment, vegetation height is classified into four categories such as
bare, grass and Pinus pumila (under 1.5 m), low (over 1.5 m and under 6 m), middle
(over 6 m and under 10 m) and high (over 10 m). Thickness of crown of each grid is
calculated by difference of max value and minimum value of random point data
except ground surface. Thickness of crown of high tree is classified into two
categories such as thin (under 10 m) and thick (over 10 m). The author defines
that evergreen trees are those with difference between vegetation height on summer
(Hs) and vegetation height on winter (Hw) under 3 m and Hs over 7 m, and other
trees are deciduous trees. The deciduous tree, which Hw is over 5 m is defined to
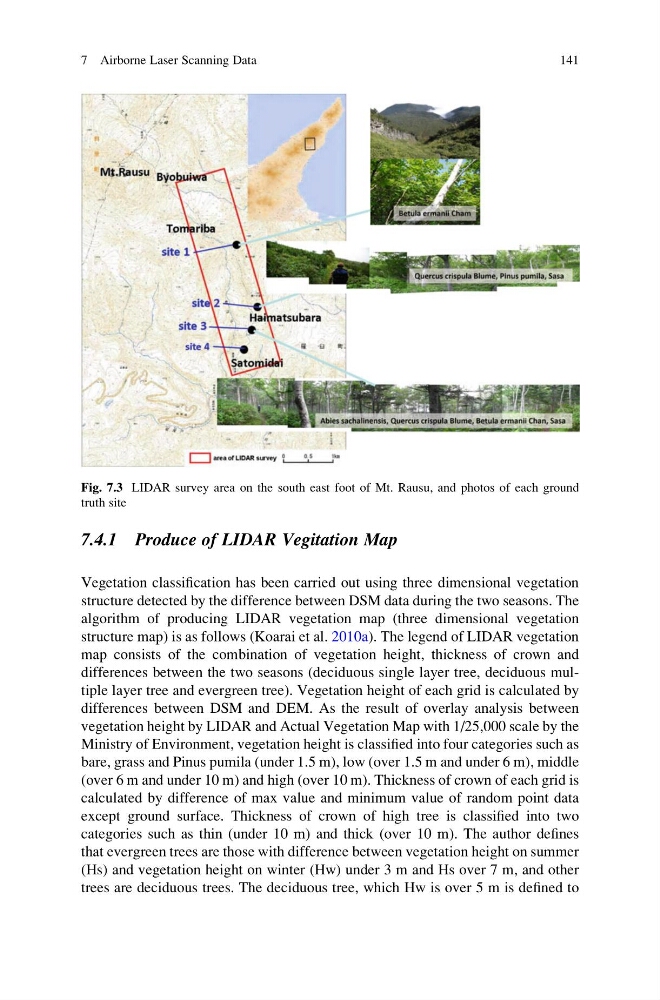
Fig. 7.3 LIDAR survey area on the south east foot of Mt. Rausu, and photos of each ground
truth site
7 Airborne Laser Scanning Data
141
Vegetation classification has been carried out using three dimensional vegetation
structure detected by the difference between DSM data during the two seasons. The
algorithm of producing LIDAR vegetation map (three dimensional vegetation
structure map) is as follows (Koarai et al. 2010a). The legend of LIDAR vegetation
map consists of the combination of vegetation height, thickness of crown and
differences between the two seasons (deciduous single layer tree, deciduous multiple layer tree and evergreen tree). Vegetation height of each grid is calculated by
differences between DSM and DEM. As the result of overlay analysis between
vegetation height by LIDAR and Actual Vegetation Map with 1/25,000 scale by the
Ministry of Environment, vegetation height is classified into four categories such as
bare, grass and Pinus pumila (under 1.5 m), low (over 1.5 m and under 6 m), middle
(over 6 m and under 10 m) and high (over 10 m). Thickness of crown of each grid is
calculated by difference of max value and minimum value of random point data
except ground surface. Thickness of crown of high tree is classified into two
categories such as thin (under 10 m) and thick (over 10 m). The author defines
that evergreen trees are those with difference between vegetation height on summer
(Hs) and vegetation height on winter (Hw) under 3 m and Hs over 7 m, and other
trees are deciduous trees. The deciduous tree, which Hw is over 5 m is defined to
Fig. 7.3 LIDAR survey area on the south east foot of Mt. Rausu, and photos of each ground
truth site
7 Airborne Laser Scanning Data
141