

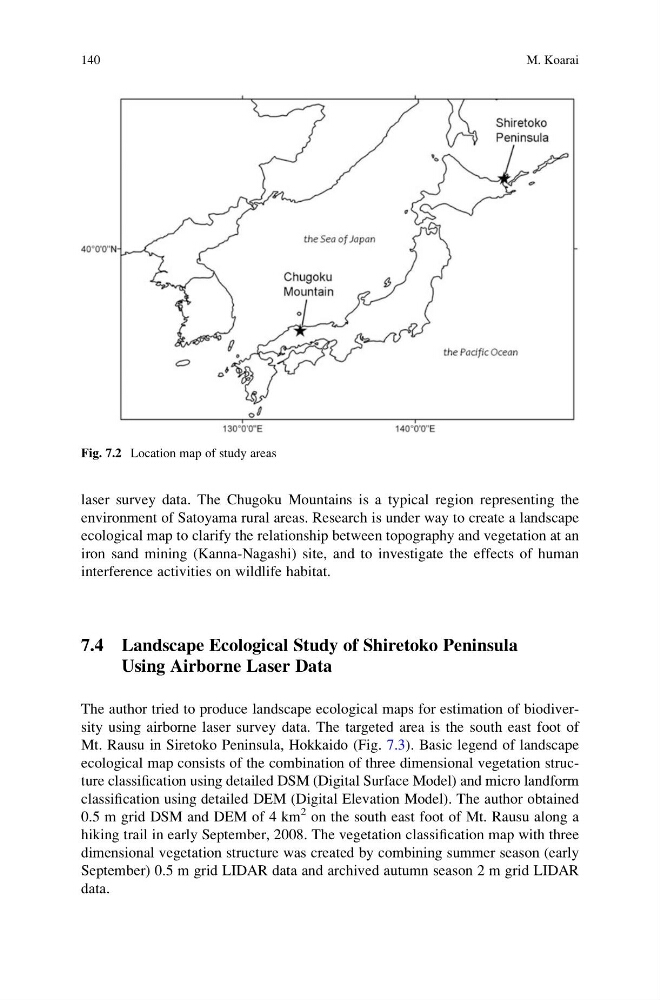
laser survey data. The Chugoku Mountains is a typical region representing the
environment of Satoyama rural areas. Research is under way to create a landscape
ecological map to clarify the relationship between topography and vegetation at an
iron sand mining (Kanna-Nagashi) site, and to investigate the effects of human
interference activities on wildlife habitat.
7.4 Landscape Ecological Study of Shiretoko Peninsula
Using Airborne Laser Data
The author tried to produce landscape ecological maps for estimation of biodiversity using airborne laser survey data. The targeted area is the south east foot of
Mt. Rausu in Siretoko Peninsula, Hokkaido (Fig. 7.3). Basic legend of landscape
ecological map consists of the combination of three dimensional vegetation structure classification using detailed DSM (Digital Surface Model) and micro landform
classification using detailed DEM (Digital Elevation Model). The author obtained
0.5 m grid DSM and DEM of 4 km
2 on the south east foot of Mt. Rausu along a
hiking trail in early September, 2008. The vegetation classification map with three
dimensional vegetation structure was created by combining summer season (early
September) 0.5 m grid LIDAR data and archived autumn season 2 m grid LIDAR
data.
Fig. 7.2 Location map of study areas
140
M. Koarai
environment of Satoyama rural areas. Research is under way to create a landscape
ecological map to clarify the relationship between topography and vegetation at an
iron sand mining (Kanna-Nagashi) site, and to investigate the effects of human
interference activities on wildlife habitat.
7.4 Landscape Ecological Study of Shiretoko Peninsula
Using Airborne Laser Data
The author tried to produce landscape ecological maps for estimation of biodiversity using airborne laser survey data. The targeted area is the south east foot of
Mt. Rausu in Siretoko Peninsula, Hokkaido (Fig. 7.3). Basic legend of landscape
ecological map consists of the combination of three dimensional vegetation structure classification using detailed DSM (Digital Surface Model) and micro landform
classification using detailed DEM (Digital Elevation Model). The author obtained
0.5 m grid DSM and DEM of 4 km
2 on the south east foot of Mt. Rausu along a
hiking trail in early September, 2008. The vegetation classification map with three
dimensional vegetation structure was created by combining summer season (early
September) 0.5 m grid LIDAR data and archived autumn season 2 m grid LIDAR
data.
Fig. 7.2 Location map of study areas
140
M. Koarai