

CC ¼
X
x À x
ð
Þ: y À y
ð
Þ
ffiffiffiffiffiffiffiffiffiffiffiffiffiffiffiffiffiffiffiffiffiffiffiffiffiffiffiffiffiffiffiffiffiffiffiffiffiffiffiffiffi X
x À x
ð
Þ
2 : y À y
ð
Þ
2
q
ð5:3Þ
where x, y are independent and depend data values
x, y are average values of x, y.
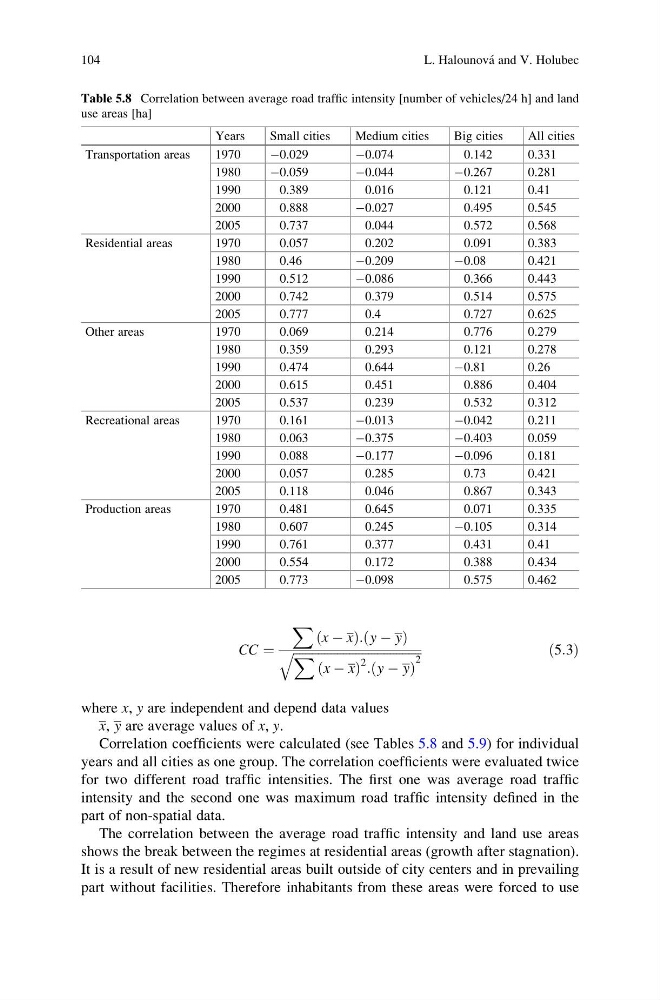
Correlation coefficients were calculated (see Tables 5.8 and 5.9) for individual
years and all cities as one group. The correlation coefficients were evaluated twice
for two different road traffic intensities. The first one was average road traffic
intensity and the second one was maximum road traffic intensity defined in the
part of non-spatial data.
The correlation between the average road traffic intensity and land use areas
shows the break between the regimes at residential areas (growth after stagnation).
It is a result of new residential areas built outside of city centers and in prevailing
part without facilities. Therefore inhabitants from these areas were forced to use
Table 5.8 Correlation between average road traffic intensity [number of vehicles/24 h] and land
use areas [ha]
Years
Small cities
Medium cities
Big cities
All cities
Transportation areas
1970
À0.029
À0.074
0.142
0.331
1980
À0.059
À0.044
À0.267
0.281
1990
0.389
0.016
0.121
0.41
2000
0.888
À0.027
0.495
0.545
2005
0.737
0.044
0.572
0.568
Residential areas
1970
0.057
0.202
0.091
0.383
1980
0.46
À0.209
À0.08
0.421
1990
0.512
À0.086
0.366
0.443
2000
0.742
0.379
0.514
0.575
2005
0.777
0.4
0.727
0.625
Other areas
1970
0.069
0.214
0.776
0.279
1980
0.359
0.293
0.121
0.278
1990
0.474
0.644
À0.81
0.26
2000
0.615
0.451
0.886
0.404
2005
0.537
0.239
0.532
0.312
Recreational areas
1970
0.161
À0.013
À0.042
0.211
1980
0.063
À0.375
À0.403
0.059
1990
0.088
À0.177
À0.096
0.181
2000
0.057
0.285
0.73
0.421
2005
0.118
0.046
0.867
0.343
Production areas
1970
0.481
0.645
0.071
0.335
1980
0.607
0.245
À0.105
0.314
1990
0.761
0.377
0.431
0.41
2000
0.554
0.172
0.388
0.434
2005
0.773
À0.098
0.575
0.462
104
L. Halounova ´ and V. Holubec
X
x À x
ð
Þ: y À y
ð
Þ
ffiffiffiffiffiffiffiffiffiffiffiffiffiffiffiffiffiffiffiffiffiffiffiffiffiffiffiffiffiffiffiffiffiffiffiffiffiffiffiffiffi X
x À x
ð
Þ
2 : y À y
ð
Þ
2
q
ð5:3Þ
where x, y are independent and depend data values
x, y are average values of x, y.
Correlation coefficients were calculated (see Tables 5.8 and 5.9) for individual
years and all cities as one group. The correlation coefficients were evaluated twice
for two different road traffic intensities. The first one was average road traffic
intensity and the second one was maximum road traffic intensity defined in the
part of non-spatial data.
The correlation between the average road traffic intensity and land use areas
shows the break between the regimes at residential areas (growth after stagnation).
It is a result of new residential areas built outside of city centers and in prevailing
part without facilities. Therefore inhabitants from these areas were forced to use
Table 5.8 Correlation between average road traffic intensity [number of vehicles/24 h] and land
use areas [ha]
Years
Small cities
Medium cities
Big cities
All cities
Transportation areas
1970
À0.029
À0.074
0.142
0.331
1980
À0.059
À0.044
À0.267
0.281
1990
0.389
0.016
0.121
0.41
2000
0.888
À0.027
0.495
0.545
2005
0.737
0.044
0.572
0.568
Residential areas
1970
0.057
0.202
0.091
0.383
1980
0.46
À0.209
À0.08
0.421
1990
0.512
À0.086
0.366
0.443
2000
0.742
0.379
0.514
0.575
2005
0.777
0.4
0.727
0.625
Other areas
1970
0.069
0.214
0.776
0.279
1980
0.359
0.293
0.121
0.278
1990
0.474
0.644
À0.81
0.26
2000
0.615
0.451
0.886
0.404
2005
0.537
0.239
0.532
0.312
Recreational areas
1970
0.161
À0.013
À0.042
0.211
1980
0.063
À0.375
À0.403
0.059
1990
0.088
À0.177
À0.096
0.181
2000
0.057
0.285
0.73
0.421
2005
0.118
0.046
0.867
0.343
Production areas
1970
0.481
0.645
0.071
0.335
1980
0.607
0.245
À0.105
0.314
1990
0.761
0.377
0.431
0.41
2000
0.554
0.172
0.388
0.434
2005
0.773
À0.098
0.575
0.462
104
L. Halounova ´ and V. Holubec