

personal vehicles for commuting and services. Recreational areas suggest a break
by higher correlation values in medium and big cities. The break can be found also
in production areas in all cities from higher values in 1990 than 2000, however, this
decreasing trend changes between 2000 and 2005 to increasing in small and big
cities.
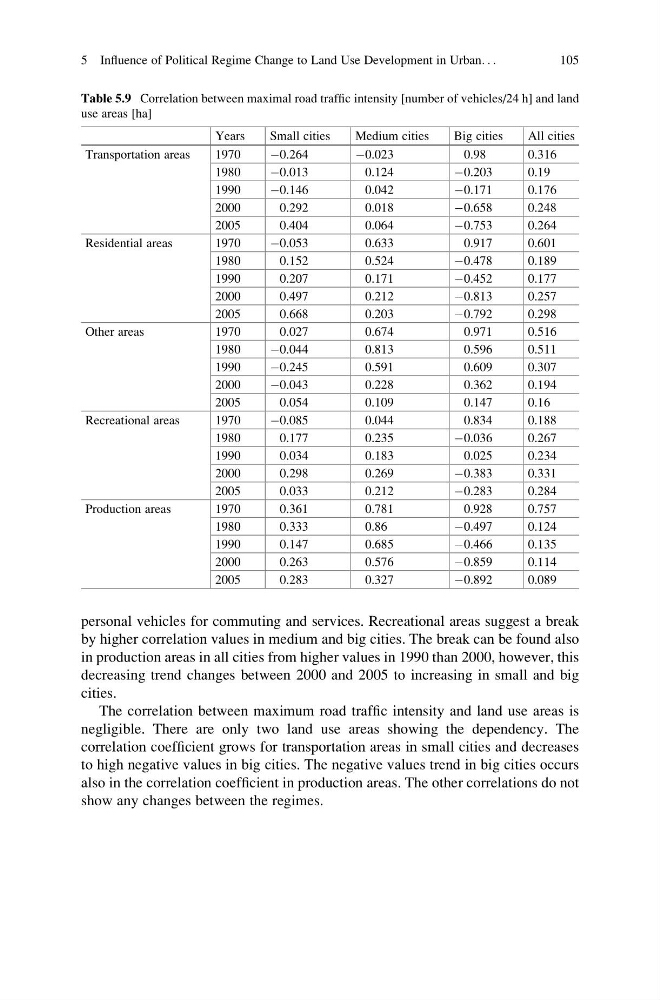
The correlation between maximum road traffic intensity and land use areas is
negligible. There are only two land use areas showing the dependency. The
correlation coefficient grows for transportation areas in small cities and decreases
to high negative values in big cities. The negative values trend in big cities occurs
also in the correlation coefficient in production areas. The other correlations do not
show any changes between the regimes.
Table 5.9 Correlation between maximal road traffic intensity [number of vehicles/24 h] and land
use areas [ha]
Years
Small cities
Medium cities
Big cities
All cities
Transportation areas
1970
À0.264
À0.023
0.98
0.316
1980
À0.013
0.124
À0.203
0.19
1990
À0.146
0.042
À0.171
0.176
2000
0.292
0.018
À0.658
0.248
2005
0.404
0.064
À0.753
0.264
Residential areas
1970
À0.053
0.633
0.917
0.601
1980
0.152
0.524
À0.478
0.189
1990
0.207
0.171
À0.452
0.177
2000
0.497
0.212
À0.813
0.257
2005
0.668
0.203
À0.792
0.298
Other areas
1970
0.027
0.674
0.971
0.516
1980
À0.044
0.813
0.596
0.511
1990
À0.245
0.591
0.609
0.307
2000
À0.043
0.228
0.362
0.194
2005
0.054
0.109
0.147
0.16
Recreational areas
1970
À0.085
0.044
0.834
0.188
1980
0.177
0.235
À0.036
0.267
1990
0.034
0.183
0.025
0.234
2000
0.298
0.269
À0.383
0.331
2005
0.033
0.212
À0.283
0.284
Production areas
1970
0.361
0.781
0.928
0.757
1980
0.333
0.86
À0.497
0.124
1990
0.147
0.685
À0.466
0.135
2000
0.263
0.576
À0.859
0.114
2005
0.283
0.327
À0.892
0.089
5 Influence of Political Regime Change to Land Use Development in Urban. . .
105
by higher correlation values in medium and big cities. The break can be found also
in production areas in all cities from higher values in 1990 than 2000, however, this
decreasing trend changes between 2000 and 2005 to increasing in small and big
cities.
The correlation between maximum road traffic intensity and land use areas is
negligible. There are only two land use areas showing the dependency. The
correlation coefficient grows for transportation areas in small cities and decreases
to high negative values in big cities. The negative values trend in big cities occurs
also in the correlation coefficient in production areas. The other correlations do not
show any changes between the regimes.
Table 5.9 Correlation between maximal road traffic intensity [number of vehicles/24 h] and land
use areas [ha]
Years
Small cities
Medium cities
Big cities
All cities
Transportation areas
1970
À0.264
À0.023
0.98
0.316
1980
À0.013
0.124
À0.203
0.19
1990
À0.146
0.042
À0.171
0.176
2000
0.292
0.018
À0.658
0.248
2005
0.404
0.064
À0.753
0.264
Residential areas
1970
À0.053
0.633
0.917
0.601
1980
0.152
0.524
À0.478
0.189
1990
0.207
0.171
À0.452
0.177
2000
0.497
0.212
À0.813
0.257
2005
0.668
0.203
À0.792
0.298
Other areas
1970
0.027
0.674
0.971
0.516
1980
À0.044
0.813
0.596
0.511
1990
À0.245
0.591
0.609
0.307
2000
À0.043
0.228
0.362
0.194
2005
0.054
0.109
0.147
0.16
Recreational areas
1970
À0.085
0.044
0.834
0.188
1980
0.177
0.235
À0.036
0.267
1990
0.034
0.183
0.025
0.234
2000
0.298
0.269
À0.383
0.331
2005
0.033
0.212
À0.283
0.284
Production areas
1970
0.361
0.781
0.928
0.757
1980
0.333
0.86
À0.497
0.124
1990
0.147
0.685
À0.466
0.135
2000
0.263
0.576
À0.859
0.114
2005
0.283
0.327
À0.892
0.089
5 Influence of Political Regime Change to Land Use Development in Urban. . .
105