

spatial resolution, spectral bands, and temporal resolution, and to choose other data
describing the features. As there are various data with similar spatial and spectral
characteristics like aerial photographs and VHR data, e.g., temporal resolution, date
and price can become the decisive issues.
5.3.4 Non-spatial Data
Non-spatial data were twofold. Statistical data were collected and processed from
the Czech Statistical Office (CSO) and are available on their web site http://www.
czso.cz. They are updated at least once per year. The only statistical indicator from
CSO used in this chapter was the number of inhabitants in cities. The rest – 12 – of
the indicators were calculated from the statistical and spatial data and are in
Table 5.3. The 14th indicator is road traffic intensity.
The average number of inhabitants (see Table 5.3) is calculated for individual
years as an average of value of all cities in individual groups – small, medium and
big cities from statistical values in the appropriate years. Average population
growth and other indicators were calculated in the same way. All these values
were used in the following indicators where individual land use areas were determined from spatial data for individual years (1979, 1980. . .). Six indicators show
the spatial development of land use areas and core areas in individual city groups
and were determined in GIS. Six indicators were calculated as ratios between the
average number of inhabitants and individual land use areas (one value for each
city) and core areas.
Road traffic intensity data have been collected since 1968 and are archived by
the Road and Motorway Directorate. At present this chapter comprises of the
evaluations from 1973, 1980, 1990, 2000, and 2005. The Directorate measures
the number of all passing vehicles in selected points within 24 h. These points are
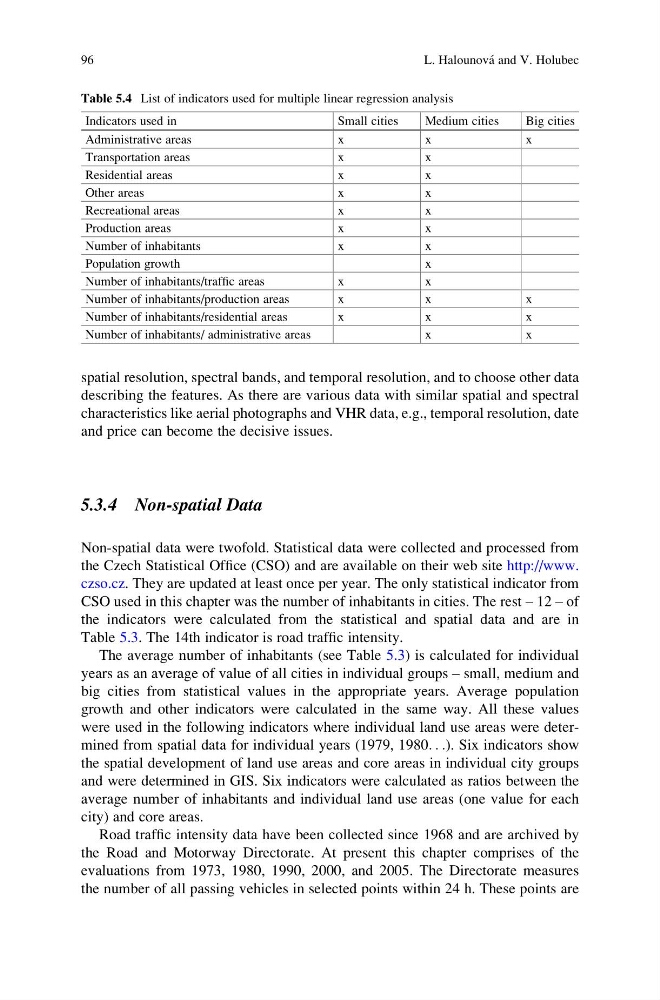
Table 5.4 List of indicators used for multiple linear regression analysis
Indicators used in
Small cities
Medium cities
Big cities
Administrative areas
x
x
x
Transportation areas
x
x
Residential areas
x
x
Other areas
x
x
Recreational areas
x
x
Production areas
x
x
Number of inhabitants
x
x
Population growth
x
Number of inhabitants/traffic areas
x
x
Number of inhabitants/production areas
x
x
x
Number of inhabitants/residential areas
x
x
x
Number of inhabitants/ administrative areas
x
x
96
L. Halounova ´ and V. Holubec
describing the features. As there are various data with similar spatial and spectral
characteristics like aerial photographs and VHR data, e.g., temporal resolution, date
and price can become the decisive issues.
5.3.4 Non-spatial Data
Non-spatial data were twofold. Statistical data were collected and processed from
the Czech Statistical Office (CSO) and are available on their web site http://www.
czso.cz. They are updated at least once per year. The only statistical indicator from
CSO used in this chapter was the number of inhabitants in cities. The rest – 12 – of
the indicators were calculated from the statistical and spatial data and are in
Table 5.3. The 14th indicator is road traffic intensity.
The average number of inhabitants (see Table 5.3) is calculated for individual
years as an average of value of all cities in individual groups – small, medium and
big cities from statistical values in the appropriate years. Average population
growth and other indicators were calculated in the same way. All these values
were used in the following indicators where individual land use areas were determined from spatial data for individual years (1979, 1980. . .). Six indicators show
the spatial development of land use areas and core areas in individual city groups
and were determined in GIS. Six indicators were calculated as ratios between the
average number of inhabitants and individual land use areas (one value for each
city) and core areas.
Road traffic intensity data have been collected since 1968 and are archived by
the Road and Motorway Directorate. At present this chapter comprises of the
evaluations from 1973, 1980, 1990, 2000, and 2005. The Directorate measures
the number of all passing vehicles in selected points within 24 h. These points are
Table 5.4 List of indicators used for multiple linear regression analysis
Indicators used in
Small cities
Medium cities
Big cities
Administrative areas
x
x
x
Transportation areas
x
x
Residential areas
x
x
Other areas
x
x
Recreational areas
x
x
Production areas
x
x
Number of inhabitants
x
x
Population growth
x
Number of inhabitants/traffic areas
x
x
Number of inhabitants/production areas
x
x
x
Number of inhabitants/residential areas
x
x
x
Number of inhabitants/ administrative areas
x
x
96
L. Halounova ´ and V. Holubec