

(1970, 1980, 1990, 1995, 2000 and 2005) and the remote sensing data was less than
2 years. Land use polygons of individual years were edited and topologically
corrected not only for individual years, but also between years.
The application of remote sensing data and city maps data allowed to use the
knowledge of urban architects and to process a reliable and objective land use of
urban areas. City maps combined with aerial photographs – show and help to
interpret individual land use classes. Aerial photographs are – unlike city maps –
accurately dated and it is necessary for additional analyses with other data. GIS
analyses are a very good method how to locate trends in the spatial development of
features occurring on Earth, in individual countries, or regions. The key point is to
decide what spatial/remote sensing data are suitable, especially their scale and thus
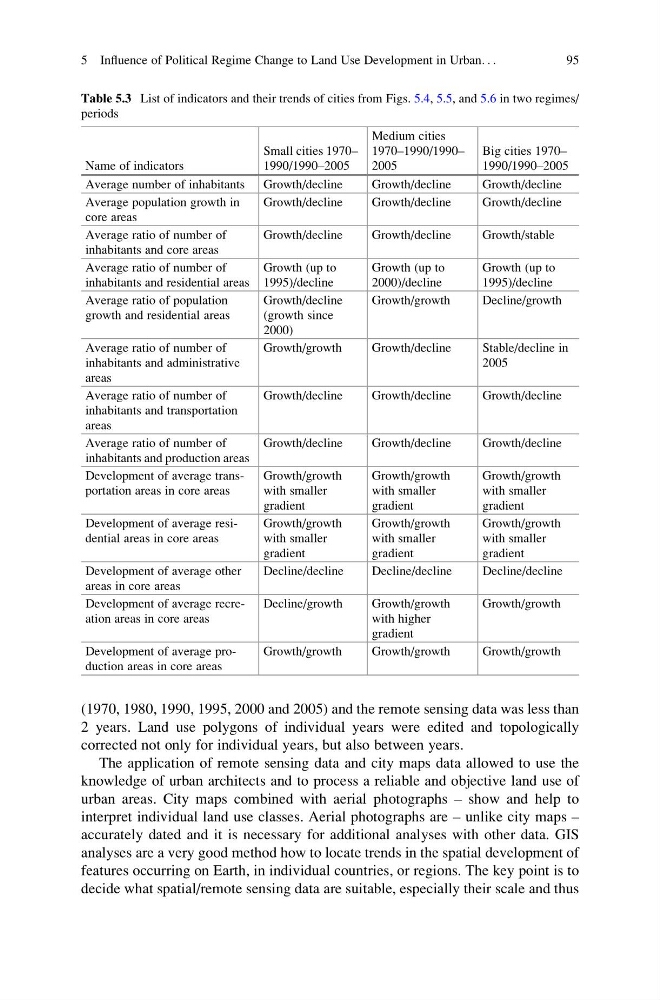
Table 5.3 List of indicators and their trends of cities from Figs. 5.4, 5.5, and 5.6 in two regimes/
periods
Name of indicators
Small cities 1970–
1990/1990–2005
Medium cities
1970–1990/1990–
2005
Big cities 1970–
1990/1990–2005
Average number of inhabitants Growth/decline
Growth/decline
Growth/decline
Average population growth in
core areas
Growth/decline
Growth/decline
Growth/decline
Average ratio of number of
inhabitants and core areas
Growth/decline
Growth/decline
Growth/stable
Average ratio of number of
inhabitants and residential areas
Growth (up to
1995)/decline
Growth (up to
2000)/decline
Growth (up to
1995)/decline
Average ratio of population
growth and residential areas
Growth/decline
(growth since
2000)
Growth/growth
Decline/growth
Average ratio of number of
inhabitants and administrative
areas
Growth/growth
Growth/decline
Stable/decline in
2005
Average ratio of number of
inhabitants and transportation
areas
Growth/decline
Growth/decline
Growth/decline
Average ratio of number of
inhabitants and production areas
Growth/decline
Growth/decline
Growth/decline
Development of average transportation areas in core areas
Growth/growth
with smaller
gradient
Growth/growth
with smaller
gradient
Growth/growth
with smaller
gradient
Development of average residential areas in core areas
Growth/growth
with smaller
gradient
Growth/growth
with smaller
gradient
Growth/growth
with smaller
gradient
Development of average other
areas in core areas
Decline/decline
Decline/decline
Decline/decline
Development of average recreation areas in core areas
Decline/growth
Growth/growth
with higher
gradient
Growth/growth
Development of average production areas in core areas
Growth/growth
Growth/growth
Growth/growth
5 Influence of Political Regime Change to Land Use Development in Urban. . .
95
2 years. Land use polygons of individual years were edited and topologically
corrected not only for individual years, but also between years.
The application of remote sensing data and city maps data allowed to use the
knowledge of urban architects and to process a reliable and objective land use of
urban areas. City maps combined with aerial photographs – show and help to
interpret individual land use classes. Aerial photographs are – unlike city maps –
accurately dated and it is necessary for additional analyses with other data. GIS
analyses are a very good method how to locate trends in the spatial development of
features occurring on Earth, in individual countries, or regions. The key point is to
decide what spatial/remote sensing data are suitable, especially their scale and thus
Table 5.3 List of indicators and their trends of cities from Figs. 5.4, 5.5, and 5.6 in two regimes/
periods
Name of indicators
Small cities 1970–
1990/1990–2005
Medium cities
1970–1990/1990–
2005
Big cities 1970–
1990/1990–2005
Average number of inhabitants Growth/decline
Growth/decline
Growth/decline
Average population growth in
core areas
Growth/decline
Growth/decline
Growth/decline
Average ratio of number of
inhabitants and core areas
Growth/decline
Growth/decline
Growth/stable
Average ratio of number of
inhabitants and residential areas
Growth (up to
1995)/decline
Growth (up to
2000)/decline
Growth (up to
1995)/decline
Average ratio of population
growth and residential areas
Growth/decline
(growth since
2000)
Growth/growth
Decline/growth
Average ratio of number of
inhabitants and administrative
areas
Growth/growth
Growth/decline
Stable/decline in
2005
Average ratio of number of
inhabitants and transportation
areas
Growth/decline
Growth/decline
Growth/decline
Average ratio of number of
inhabitants and production areas
Growth/decline
Growth/decline
Growth/decline
Development of average transportation areas in core areas
Growth/growth
with smaller
gradient
Growth/growth
with smaller
gradient
Growth/growth
with smaller
gradient
Development of average residential areas in core areas
Growth/growth
with smaller
gradient
Growth/growth
with smaller
gradient
Growth/growth
with smaller
gradient
Development of average other
areas in core areas
Decline/decline
Decline/decline
Decline/decline
Development of average recreation areas in core areas
Decline/growth
Growth/growth
with higher
gradient
Growth/growth
Development of average production areas in core areas
Growth/growth
Growth/growth
Growth/growth
5 Influence of Political Regime Change to Land Use Development in Urban. . .
95