

303
Classification of Change
Within any landscape, changes are often the result of specific events that are either
natural (e.g., fires, floods or storms) or the result of human activities (e.g., deforestation, mine excavation and cultivation). However, changes may be the result of
longer- term processes, which again are also natural (e.g., vegetation growth,
increased tidal inundation) or human induced (e.g., urban expansion, agricultural
homogenisation). Climatic fluctuation may lead to changes in the frequency and
intensity of events or alterations of long-term processes (e.g., mangrove extent
because of progressive rises in sea level). Changes across a landscape also occur at
different times, rates and frequencies and across different scales. For this reason,
detection and classification from earth observation data has proved difficult as the
acquisition dates and frequencies often do not match those associated with events
and processes occurring at the ground level. Indeed, many studies focusing on
change detection have typically dealt with only one type of change, with notable
examples being deforestation monitoring and flood mapping, and little or no consideration is given to changes occurring within adjacent or proximal classes or at different times and rates. Furthermore, change is often detected on the basis of the
differences in only one or a few remotely sensed variables, whether they are spectral
reflectance or radar backscatter, indices or retrieved environmental variables.
Within the EODESM system, events and processes are detected when changes in
the components of LCCS classes are observed. As an example, the annual period of
inundation within a wetland may decline from 292 to 182 days, with this corresponding to a reduction in annual hydro-period from B1 (>9 months) to B8
(4–6 months). However, there may be additional evidence that supports the interpretation that such a change might be the result of drying of the landscape. This might
include a change from flowing to standing water and/or turbid to clear water over a
similar time frame, which are both thematic categories, but also in environmental
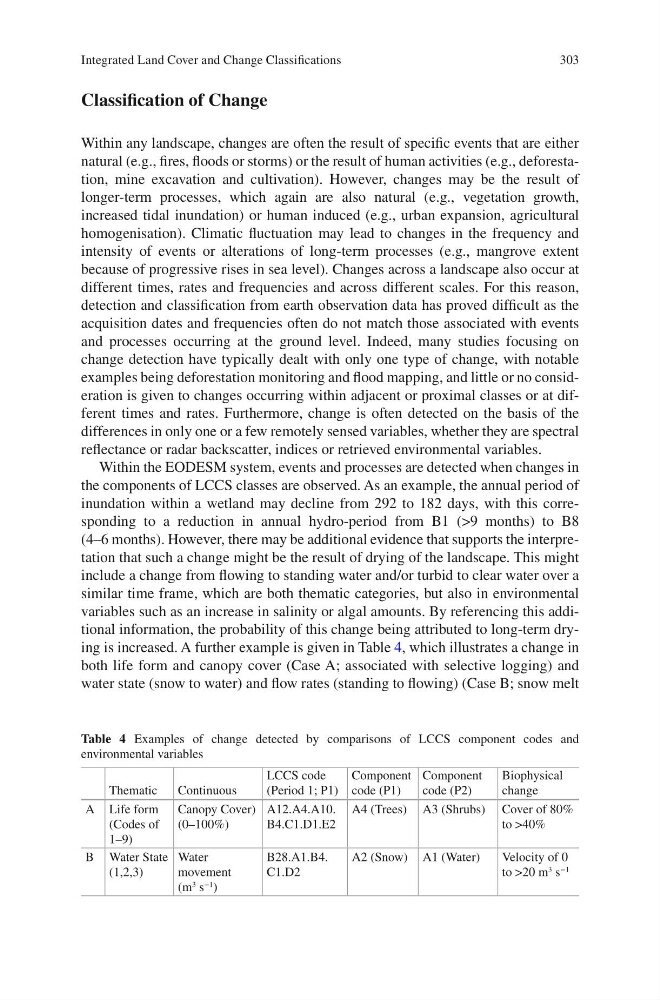
variables such as an increase in salinity or algal amounts. By referencing this additional information, the probability of this change being attributed to long-term drying is increased. A further example is given in Table 4, which illustrates a change in
both life form and canopy cover (Case A; associated with selective logging) and
water state (snow to water) and flow rates (standing to flowing) (Case B; snow melt
Table 4 Examples of change detected by comparisons of LCCS component codes and
environmental variables
Thematic
Continuous
LCCS code
(Period 1; P1)
Component
code (P1)
Component
code (P2)
Biophysical
change
A Life form
(Codes of
1–9)
Canopy Cover)
(0–100%)
A12.A4.A10.
B4.C1.D1.E2
A4 (Trees) A3 (Shrubs) Cover of 80%
to >40%
B Water State
(1,2,3)
Water
movement
(m
3
s
−1
)
B28.A1.B4.
C1.D2
A2 (Snow) A1 (Water)
Velocity of 0
to >20 m
3
s
−1
Integrated Land Cover and Change Classifications
Classification of Change
Within any landscape, changes are often the result of specific events that are either
natural (e.g., fires, floods or storms) or the result of human activities (e.g., deforestation, mine excavation and cultivation). However, changes may be the result of
longer- term processes, which again are also natural (e.g., vegetation growth,
increased tidal inundation) or human induced (e.g., urban expansion, agricultural
homogenisation). Climatic fluctuation may lead to changes in the frequency and
intensity of events or alterations of long-term processes (e.g., mangrove extent
because of progressive rises in sea level). Changes across a landscape also occur at
different times, rates and frequencies and across different scales. For this reason,
detection and classification from earth observation data has proved difficult as the
acquisition dates and frequencies often do not match those associated with events
and processes occurring at the ground level. Indeed, many studies focusing on
change detection have typically dealt with only one type of change, with notable
examples being deforestation monitoring and flood mapping, and little or no consideration is given to changes occurring within adjacent or proximal classes or at different times and rates. Furthermore, change is often detected on the basis of the
differences in only one or a few remotely sensed variables, whether they are spectral
reflectance or radar backscatter, indices or retrieved environmental variables.
Within the EODESM system, events and processes are detected when changes in
the components of LCCS classes are observed. As an example, the annual period of
inundation within a wetland may decline from 292 to 182 days, with this corresponding to a reduction in annual hydro-period from B1 (>9 months) to B8
(4–6 months). However, there may be additional evidence that supports the interpretation that such a change might be the result of drying of the landscape. This might
include a change from flowing to standing water and/or turbid to clear water over a
similar time frame, which are both thematic categories, but also in environmental
variables such as an increase in salinity or algal amounts. By referencing this additional information, the probability of this change being attributed to long-term drying is increased. A further example is given in Table 4, which illustrates a change in
both life form and canopy cover (Case A; associated with selective logging) and
water state (snow to water) and flow rates (standing to flowing) (Case B; snow melt
Table 4 Examples of change detected by comparisons of LCCS component codes and
environmental variables
Thematic
Continuous
LCCS code
(Period 1; P1)
Component
code (P1)
Component
code (P2)
Biophysical
change
A Life form
(Codes of
1–9)
Canopy Cover)
(0–100%)
A12.A4.A10.
B4.C1.D1.E2
A4 (Trees) A3 (Shrubs) Cover of 80%
to >40%
B Water State
(1,2,3)
Water
movement
(m
3
s
−1
)
B28.A1.B4.
C1.D2
A2 (Snow) A1 (Water)
Velocity of 0
to >20 m
3
s
−1
Integrated Land Cover and Change Classifications