

300
hydro-period (1987–2015; Pekel et al. 2016), and MODIS 500 m derived data
(e.g. 8-day snow cover from 2000; Hall and Riggs 2016). For Europe, 20 m resolution maps of tree cover density (2012), forest leaf type (2012), permanent water
(2006–2012) and impervious surfaces (2011–2012) have been generated through
the Copernicus project from optical satellite sensor data from 2001 and 2011
(Langanke et al. 2013). At local levels, more detailed retrieval has occurred using
VHR resolution and LIDAR as well as spaceborne optical and radar sensors, including ocean wind speeds (Rana et al. 2016), soil moisture (Pasolli et al. 2015) and
snow moisture content (Nagler and Rott 2000). In each case, specialist algorithms
for retrieving environmental variables have been developed through years or even
decades of research and the resulting datasets are often well suited to support the
classification and attribution of land cover classes and change according to the
LCCS-2 taxonomy. The algorithms used for the generation of environmental variables are also being made available with associated software and these can be used
for self-generation of the required data layers, though calibration and/or validation
is essential in some cases. The outputs from the EODESM system can also be used
to describe additional variables (Table 3), with these relating to, for example, disturbance regimes.
Classification of Land Covers
The FAO LCCS-2 taxonomy used in the EODESM system (Fig. 1) is hierarchical
and allows for the progressive classification of a comprehensive range of land covers from earth observation data with these corresponding to those observed at
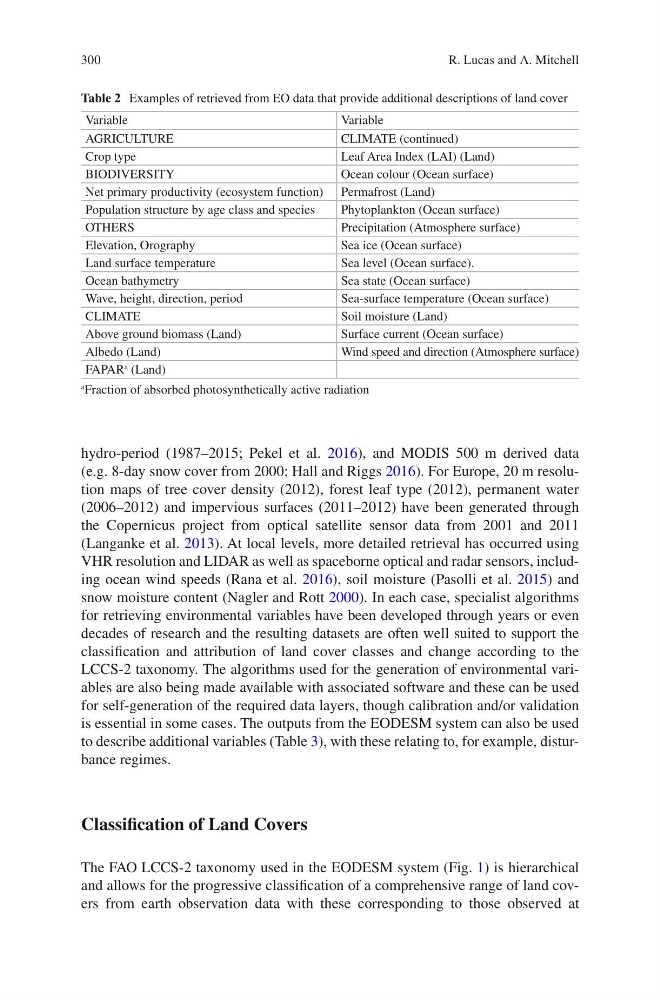
Table 2 Examples of retrieved from EO data that provide additional descriptions of land cover
Variable
Variable
AGRICULTURE
CLIMATE (continued)
Crop type
Leaf Area Index (LAI) (Land)
BIODIVERSITY
Ocean colour (Ocean surface)
Net primary productivity (ecosystem function) Permafrost (Land)
Population structure by age class and species
Phytoplankton (Ocean surface)
OTHERS
Precipitation (Atmosphere surface)
Elevation, Orography
Sea ice (Ocean surface)
Land surface temperature
Sea level (Ocean surface).
Ocean bathymetry
Sea state (Ocean surface)
Wave, height, direction, period
Sea-surface temperature (Ocean surface)
CLIMATE
Soil moisture (Land)
Above ground biomass (Land)
Surface current (Ocean surface)
Albedo (Land)
Wind speed and direction (Atmosphere surface)
FAPAR
a (Land)
a
Fraction of absorbed photosynthetically active radiation
R. Lucas and A. Mitchell
hydro-period (1987–2015; Pekel et al. 2016), and MODIS 500 m derived data
(e.g. 8-day snow cover from 2000; Hall and Riggs 2016). For Europe, 20 m resolution maps of tree cover density (2012), forest leaf type (2012), permanent water
(2006–2012) and impervious surfaces (2011–2012) have been generated through
the Copernicus project from optical satellite sensor data from 2001 and 2011
(Langanke et al. 2013). At local levels, more detailed retrieval has occurred using
VHR resolution and LIDAR as well as spaceborne optical and radar sensors, including ocean wind speeds (Rana et al. 2016), soil moisture (Pasolli et al. 2015) and
snow moisture content (Nagler and Rott 2000). In each case, specialist algorithms
for retrieving environmental variables have been developed through years or even
decades of research and the resulting datasets are often well suited to support the
classification and attribution of land cover classes and change according to the
LCCS-2 taxonomy. The algorithms used for the generation of environmental variables are also being made available with associated software and these can be used
for self-generation of the required data layers, though calibration and/or validation
is essential in some cases. The outputs from the EODESM system can also be used
to describe additional variables (Table 3), with these relating to, for example, disturbance regimes.
Classification of Land Covers
The FAO LCCS-2 taxonomy used in the EODESM system (Fig. 1) is hierarchical
and allows for the progressive classification of a comprehensive range of land covers from earth observation data with these corresponding to those observed at
Table 2 Examples of retrieved from EO data that provide additional descriptions of land cover
Variable
Variable
AGRICULTURE
CLIMATE (continued)
Crop type
Leaf Area Index (LAI) (Land)
BIODIVERSITY
Ocean colour (Ocean surface)
Net primary productivity (ecosystem function) Permafrost (Land)
Population structure by age class and species
Phytoplankton (Ocean surface)
OTHERS
Precipitation (Atmosphere surface)
Elevation, Orography
Sea ice (Ocean surface)
Land surface temperature
Sea level (Ocean surface).
Ocean bathymetry
Sea state (Ocean surface)
Wave, height, direction, period
Sea-surface temperature (Ocean surface)
CLIMATE
Soil moisture (Land)
Above ground biomass (Land)
Surface current (Ocean surface)
Albedo (Land)
Wind speed and direction (Atmosphere surface)
FAPAR
a (Land)
a
Fraction of absorbed photosynthetically active radiation
R. Lucas and A. Mitchell