

240
Discussion
The Role of Earth Observation
The main benefit of using earth observation data was the ability to provide a land
cover classification for a similar period as the camera trap surveys. The overall
accuracy of the land cover classification for the IBMTCL was relatively high, but
there was confusion between a number of classes, largely because of the high seasonal variation in the phenology of vegetation but also fires and flooding. In some
areas, dry areas became inundated during the wet season, but as the waters receded,
extensive areas of highly productive grassland established. These became senescent
as the dry season progressed and many were then subject to extensive burning.
Hence, the spectral signatures of the same area of ground varied considerably
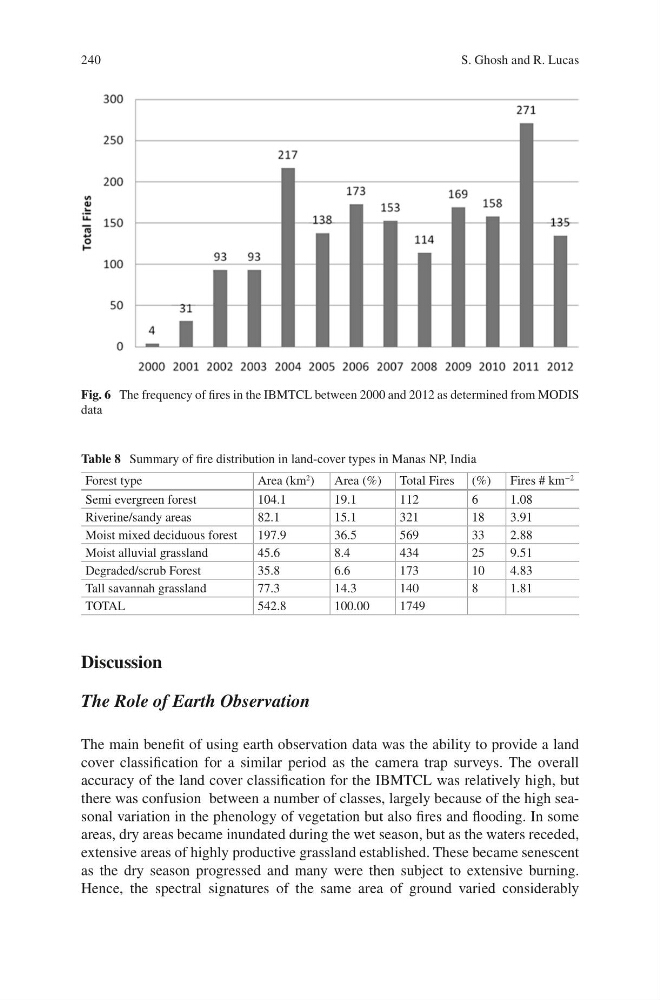
Fig. 6 The frequency of fires in the IBMTCL between 2000 and 2012 as determined from MODIS
data
Table 8 Summary of fire distribution in land-cover types in Manas NP, India
Forest type
Area (km
2 )
Area (%) Total Fires (%)
Fires # km
−2
Semi evergreen forest
104.1
19.1
112
6
1.08
Riverine/sandy areas
82.1
15.1
321
18
3.91
Moist mixed deciduous forest
197.9
36.5
569
33
2.88
Moist alluvial grassland
45.6
8.4
434
25
9.51
Degraded/scrub Forest
35.8
6.6
173
10
4.83
Tall savannah grassland
77.3
14.3
140
8
1.81
TOTAL
542.8
100.00
1749
S. Ghosh and R. Lucas
Discussion
The Role of Earth Observation
The main benefit of using earth observation data was the ability to provide a land
cover classification for a similar period as the camera trap surveys. The overall
accuracy of the land cover classification for the IBMTCL was relatively high, but
there was confusion between a number of classes, largely because of the high seasonal variation in the phenology of vegetation but also fires and flooding. In some
areas, dry areas became inundated during the wet season, but as the waters receded,
extensive areas of highly productive grassland established. These became senescent
as the dry season progressed and many were then subject to extensive burning.
Hence, the spectral signatures of the same area of ground varied considerably
Fig. 6 The frequency of fires in the IBMTCL between 2000 and 2012 as determined from MODIS
data
Table 8 Summary of fire distribution in land-cover types in Manas NP, India
Forest type
Area (km
2 )
Area (%) Total Fires (%)
Fires # km
−2
Semi evergreen forest
104.1
19.1
112
6
1.08
Riverine/sandy areas
82.1
15.1
321
18
3.91
Moist mixed deciduous forest
197.9
36.5
569
33
2.88
Moist alluvial grassland
45.6
8.4
434
25
9.51
Degraded/scrub Forest
35.8
6.6
173
10
4.83
Tall savannah grassland
77.3
14.3
140
8
1.81
TOTAL
542.8
100.00
1749
S. Ghosh and R. Lucas