

187
control points for the mosaicking procedure, so we needed to adjust the imagery by
shifting the NIR image manually by five pixels on the x-axis and three pixels on the
y-axis to ensure proper matching with RGB imagery. We used QGIS v.2.16 (QGIS
Development Team 2016) to shift the image.
Ground Truth Data
After image processing, subsections of the orthomosaics corresponding to each of
20 permanent monitoring plots were taken to the field. Within each plot, all trees
and shrubs in the image were compared to each tree and shrub in the vegetation plot.
Then, for each single-stem individual, an outline for each individual was drawn onto
the image. This was necessary as the crowns of species were commonly overlapping
where multiple stemmed individuals occurred. In total, 16 species were recorded
and only living individuals were considered. However, we excluded seven of these
species from further analysis because they occurred with an abundance of less than
ten individuals within the samples (Table 1). We then converted our paper drawings
into polygons per species in QGIS based on the RGB orthomosaic. Although
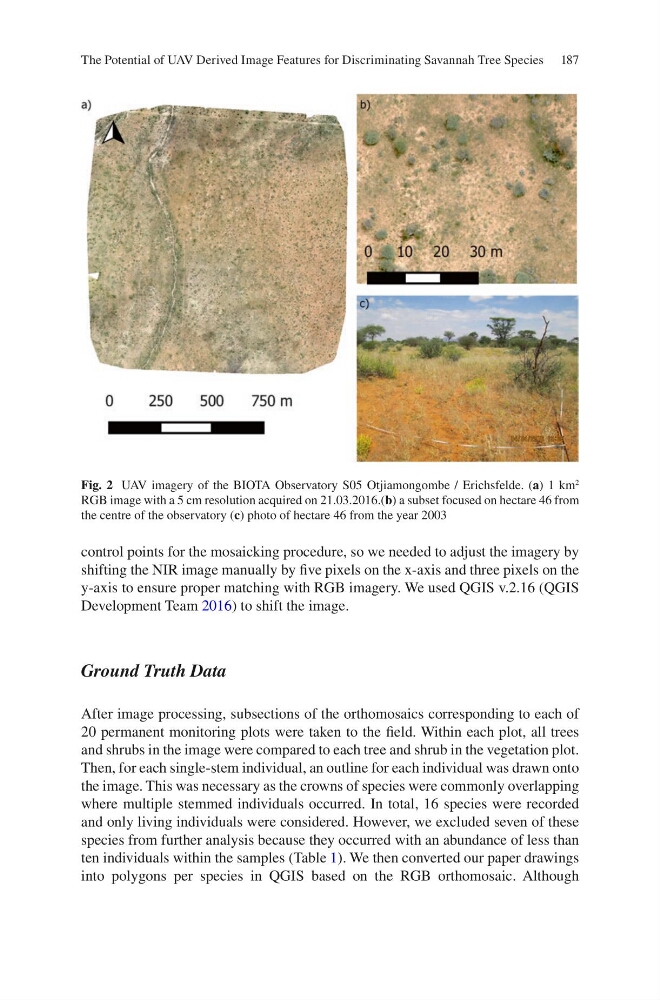
Fig. 2 UAV imagery of the BIOTA Observatory S05 Otjiamongombe / Erichsfelde. (a) 1 km
2
RGB image with a 5 cm resolution acquired on 21.03.2016.(b) a subset focused on hectare 46 from
the centre of the observatory (c) photo of hectare 46 from the year 2003
The Potential of UAV Derived Image Features for Discriminating Savannah Tree Species
control points for the mosaicking procedure, so we needed to adjust the imagery by
shifting the NIR image manually by five pixels on the x-axis and three pixels on the
y-axis to ensure proper matching with RGB imagery. We used QGIS v.2.16 (QGIS
Development Team 2016) to shift the image.
Ground Truth Data
After image processing, subsections of the orthomosaics corresponding to each of
20 permanent monitoring plots were taken to the field. Within each plot, all trees
and shrubs in the image were compared to each tree and shrub in the vegetation plot.
Then, for each single-stem individual, an outline for each individual was drawn onto
the image. This was necessary as the crowns of species were commonly overlapping
where multiple stemmed individuals occurred. In total, 16 species were recorded
and only living individuals were considered. However, we excluded seven of these
species from further analysis because they occurred with an abundance of less than
ten individuals within the samples (Table 1). We then converted our paper drawings
into polygons per species in QGIS based on the RGB orthomosaic. Although
Fig. 2 UAV imagery of the BIOTA Observatory S05 Otjiamongombe / Erichsfelde. (a) 1 km
2
RGB image with a 5 cm resolution acquired on 21.03.2016.(b) a subset focused on hectare 46 from
the centre of the observatory (c) photo of hectare 46 from the year 2003
The Potential of UAV Derived Image Features for Discriminating Savannah Tree Species