

133
Site Level Mapping: Considerations and Outputs
Choosing imagery for mapping at the site level, again, is driven by the detail needed
and the scale and intricacies of the habitat mosaics. At an individual site level, data
from Unmanned Aerial Vehicles (UAVs) red, green and blue (RGB) and near infrared (NIR) imagery and a Digital Surface Model (DSM, vertical resolution of 10 cm)
derived from stereo images can be used. The maps produced are extremely detailed
and are considered by the NBIS to be particularly useful for areas that are difficult
to access safely (e.g., salt marshes) or that cannot be visited at certain times (e.g.,
due to nesting birds on heaths). Using this approach, habitats can be mapped using
EO to distinguish vegetation at a similar scale to an NVC survey.
A limitation of using UAV data is that only one overflight might be possible.
Again, the choice of timing of the image acquisition is determined by the knowledge of the ecological and spectral characteristics of the features of most interest. In
the Norfolk Broads, the invasive Himalayan Balsam is a significant problem and its
distinctive pink blooms show up clearly, and can be mapped from the August acquisitions of UAV imagery (Fig. 8).
Using UAV data at a wetland bog complex at Dersingham, individual ash trees
within the heathland were identifiable, which could potentially indicate that the
heathland might be experiencing shrub invasion as a consequence of reduced grazing
activity. In order to maintain the ecological value of the site, selected trees may have
to be removed. The regional level mapping shows the main expanse of gorse scrub,
but not the detail of individual young trees; therefore for scrub monitoring, knowledge of the individual site and the species posing the problems should be sought
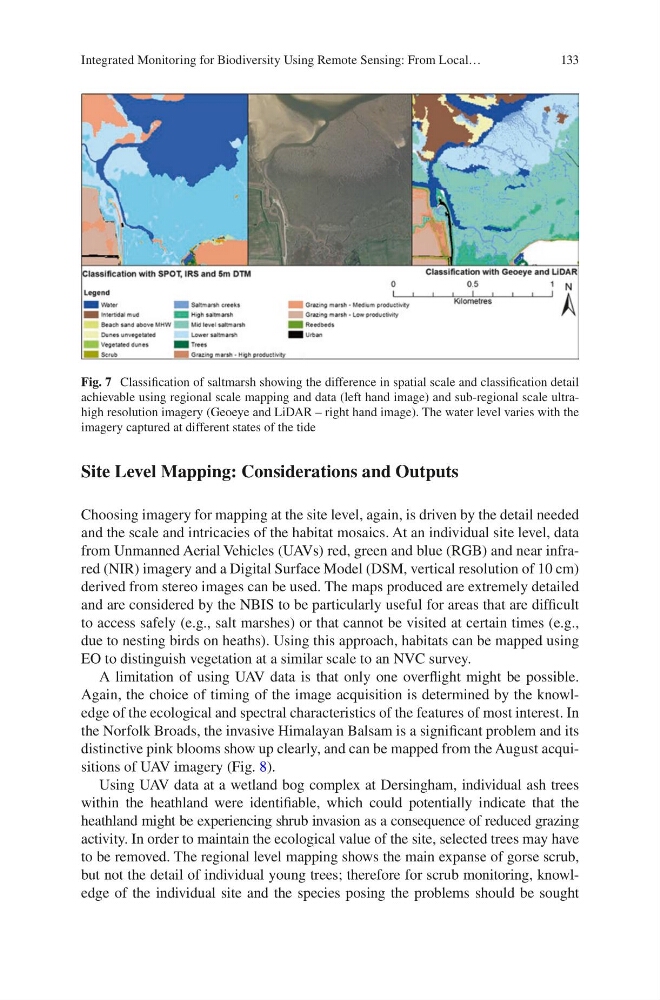
Fig. 7 Classification of saltmarsh showing the difference in spatial scale and classification detail
achievable using regional scale mapping and data (left hand image) and sub-regional scale ultrahigh resolution imagery (Geoeye and LiDAR – right hand image). The water level varies with the
imagery captured at different states of the tide
Integrated Monitoring for Biodiversity Using Remote Sensing: From Local…
Site Level Mapping: Considerations and Outputs
Choosing imagery for mapping at the site level, again, is driven by the detail needed
and the scale and intricacies of the habitat mosaics. At an individual site level, data
from Unmanned Aerial Vehicles (UAVs) red, green and blue (RGB) and near infrared (NIR) imagery and a Digital Surface Model (DSM, vertical resolution of 10 cm)
derived from stereo images can be used. The maps produced are extremely detailed
and are considered by the NBIS to be particularly useful for areas that are difficult
to access safely (e.g., salt marshes) or that cannot be visited at certain times (e.g.,
due to nesting birds on heaths). Using this approach, habitats can be mapped using
EO to distinguish vegetation at a similar scale to an NVC survey.
A limitation of using UAV data is that only one overflight might be possible.
Again, the choice of timing of the image acquisition is determined by the knowledge of the ecological and spectral characteristics of the features of most interest. In
the Norfolk Broads, the invasive Himalayan Balsam is a significant problem and its
distinctive pink blooms show up clearly, and can be mapped from the August acquisitions of UAV imagery (Fig. 8).
Using UAV data at a wetland bog complex at Dersingham, individual ash trees
within the heathland were identifiable, which could potentially indicate that the
heathland might be experiencing shrub invasion as a consequence of reduced grazing
activity. In order to maintain the ecological value of the site, selected trees may have
to be removed. The regional level mapping shows the main expanse of gorse scrub,
but not the detail of individual young trees; therefore for scrub monitoring, knowledge of the individual site and the species posing the problems should be sought
Fig. 7 Classification of saltmarsh showing the difference in spatial scale and classification detail
achievable using regional scale mapping and data (left hand image) and sub-regional scale ultrahigh resolution imagery (Geoeye and LiDAR – right hand image). The water level varies with the
imagery captured at different states of the tide
Integrated Monitoring for Biodiversity Using Remote Sensing: From Local…