

109
A number of layers were selected (see example in Table 3) based on a visual
interpretation for further field analysis as quantitative methods of validating mapping products from EO are not sufficient at validating spatial aspects of outputs
(Foody 2002). These outputs were entered into a Global Positioning System (GPS)
and were further scrutinised in the field to provide a qualitative validation and
examine which layers represented the most suitable spatial distribution. The final
layer for each class was chosen in the field. An analysis of overall accuracies determined from error matrices was also carried out.
Results
The results show that no single layer was a perfect fit for all classes within the
masked output. Table 4 shows the final layer chosen at each stage of the classification hierarchy and a different algorithm with a different input feature were chosen
each time, while Fig. 9 shows an illustration of these layers.
Figure 10 shows the overall point accuracy for layers generated from the herbaceous mask. There are some that clearly performed better than others according to this
method of determining accuracy. The layer deemed to best represent classes in the field
was the Extremely Random Forest algorithm with the BioSOS input features. There
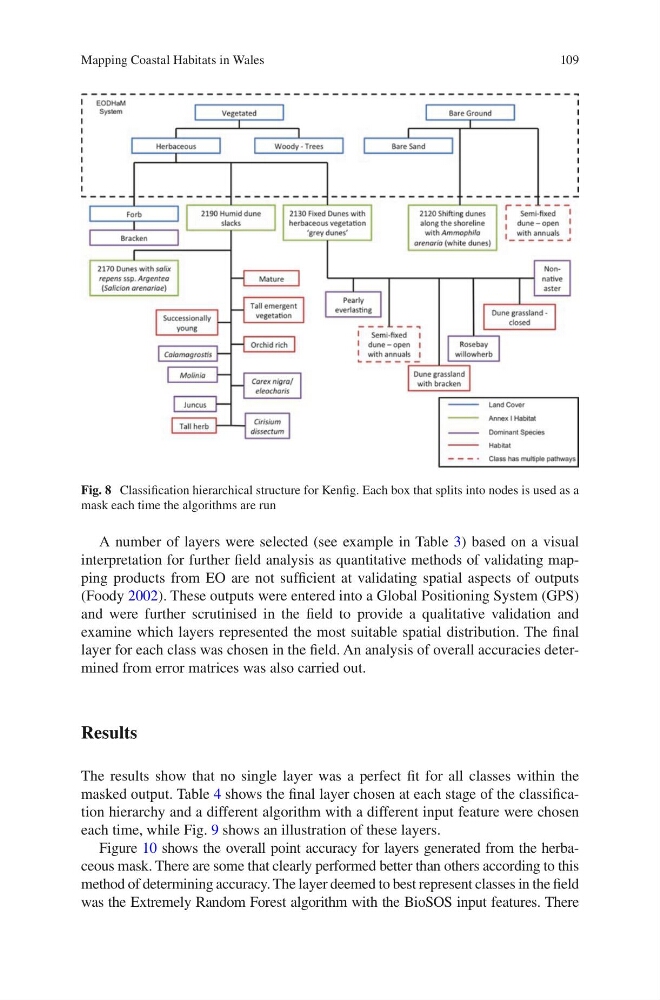
Fig. 8 Classification hierarchical structure for Kenfig. Each box that splits into nodes is used as a
mask each time the algorithms are run
Mapping Coastal Habitats in Wales
A number of layers were selected (see example in Table 3) based on a visual
interpretation for further field analysis as quantitative methods of validating mapping products from EO are not sufficient at validating spatial aspects of outputs
(Foody 2002). These outputs were entered into a Global Positioning System (GPS)
and were further scrutinised in the field to provide a qualitative validation and
examine which layers represented the most suitable spatial distribution. The final
layer for each class was chosen in the field. An analysis of overall accuracies determined from error matrices was also carried out.
Results
The results show that no single layer was a perfect fit for all classes within the
masked output. Table 4 shows the final layer chosen at each stage of the classification hierarchy and a different algorithm with a different input feature were chosen
each time, while Fig. 9 shows an illustration of these layers.
Figure 10 shows the overall point accuracy for layers generated from the herbaceous mask. There are some that clearly performed better than others according to this
method of determining accuracy. The layer deemed to best represent classes in the field
was the Extremely Random Forest algorithm with the BioSOS input features. There
Fig. 8 Classification hierarchical structure for Kenfig. Each box that splits into nodes is used as a
mask each time the algorithms are run
Mapping Coastal Habitats in Wales