

280
Stefano Burigat and Luca Chittaro
relevant information without completely neglecting other information that could become important.
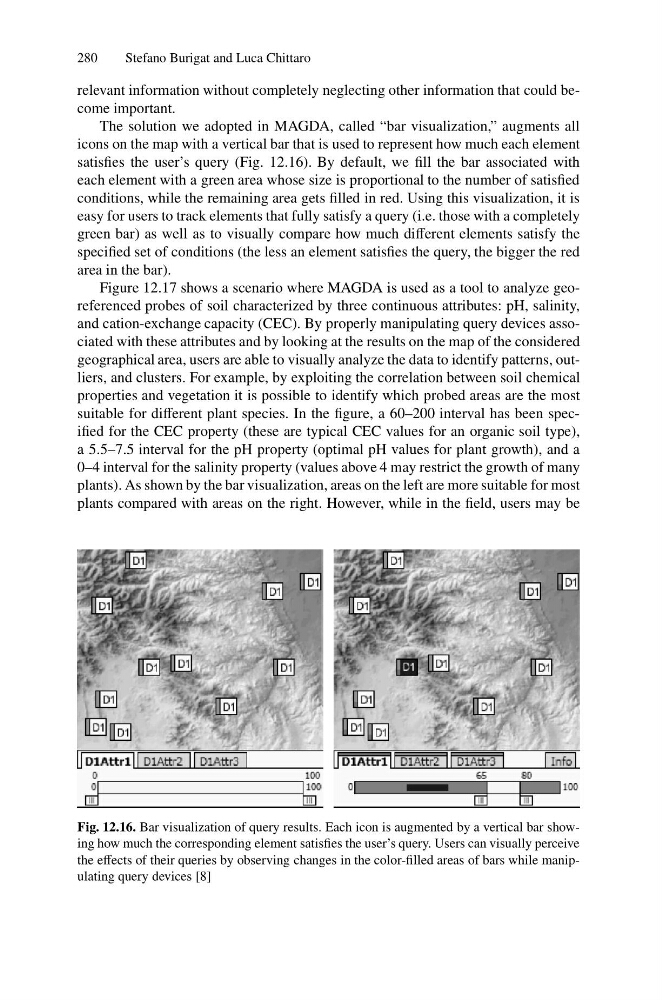
The solution we adopted in MAGDA, called “bar visualization,” augments all
icons on the map with a vertical bar that is used to represent how much each element
satisfies the user’s query (Fig. 12.16). By default, we fill the bar associated with
each element with a green area whose size is proportional to the number of satisfied
conditions, while the remaining area gets filled in red. Using this visualization, it is
easy for users to track elements that fully satisfy a query (i.e. those with a completely
green bar) as well as to visually compare how much different elements satisfy the
specified set of conditions (the less an element satisfies the query, the bigger the red
area in the bar).
Figure 12.17 shows a scenario where MAGDA is used as a tool to analyze georeferenced probes of soil characterized by three continuous attributes: pH, salinity,
and cation-exchange capacity (CEC). By properly manipulating query devices associated with these attributes and by looking at the results on the map of the considered
geographical area, users are able to visually analyze the data to identify patterns, outliers, and clusters. For example, by exploiting the correlation between soil chemical
properties and vegetation it is possible to identify which probed areas are the most
suitable for different plant species. In the figure, a 60–200 interval has been specified for the CEC property (these are typical CEC values for an organic soil type),
a 5.5–7.5 interval for the pH property (optimal pH values for plant growth), and a
0–4 interval for the salinity property (values above 4 may restrict the growth of many
plants). As shown by the bar visualization, areas on the left are more suitable for most
plants compared with areas on the right. However, while in the field, users may be
Fig. 12.16. Bar visualization of query results. Each icon is augmented by a vertical bar showing how much the corresponding element satisfies the user’s query. Users can visually perceive
the effects of their queries by observing changes in the color-filled areas of bars while manipulating query devices [8]
Stefano Burigat and Luca Chittaro
relevant information without completely neglecting other information that could become important.
The solution we adopted in MAGDA, called “bar visualization,” augments all
icons on the map with a vertical bar that is used to represent how much each element
satisfies the user’s query (Fig. 12.16). By default, we fill the bar associated with
each element with a green area whose size is proportional to the number of satisfied
conditions, while the remaining area gets filled in red. Using this visualization, it is
easy for users to track elements that fully satisfy a query (i.e. those with a completely
green bar) as well as to visually compare how much different elements satisfy the
specified set of conditions (the less an element satisfies the query, the bigger the red
area in the bar).
Figure 12.17 shows a scenario where MAGDA is used as a tool to analyze georeferenced probes of soil characterized by three continuous attributes: pH, salinity,
and cation-exchange capacity (CEC). By properly manipulating query devices associated with these attributes and by looking at the results on the map of the considered
geographical area, users are able to visually analyze the data to identify patterns, outliers, and clusters. For example, by exploiting the correlation between soil chemical
properties and vegetation it is possible to identify which probed areas are the most
suitable for different plant species. In the figure, a 60–200 interval has been specified for the CEC property (these are typical CEC values for an organic soil type),
a 5.5–7.5 interval for the pH property (optimal pH values for plant growth), and a
0–4 interval for the salinity property (values above 4 may restrict the growth of many
plants). As shown by the bar visualization, areas on the left are more suitable for most
plants compared with areas on the right. However, while in the field, users may be
Fig. 12.16. Bar visualization of query results. Each icon is augmented by a vertical bar showing how much the corresponding element satisfies the user’s query. Users can visually perceive
the effects of their queries by observing changes in the color-filled areas of bars while manipulating query devices [8]