

12 Geographical Data Visualization on Mobile Devices
279
To define queries, users interact with query devices contained in a tabbed interface, where each tab allows users to specify values for a single attribute of the
considered elements. Figure 12.14 shows an example where elements of categories
called “D1” and “D2” are shown on the map, and it is possible to specify values for
the attributes “D1Attr1,” “D1Attr2,” and “D1Attr3” of category “D1” by accessing
the appropriate tabs. Elements belonging to the currently explored category are highlighted (by shading all other elements) to improve their visibility and reduce visual
clutter.
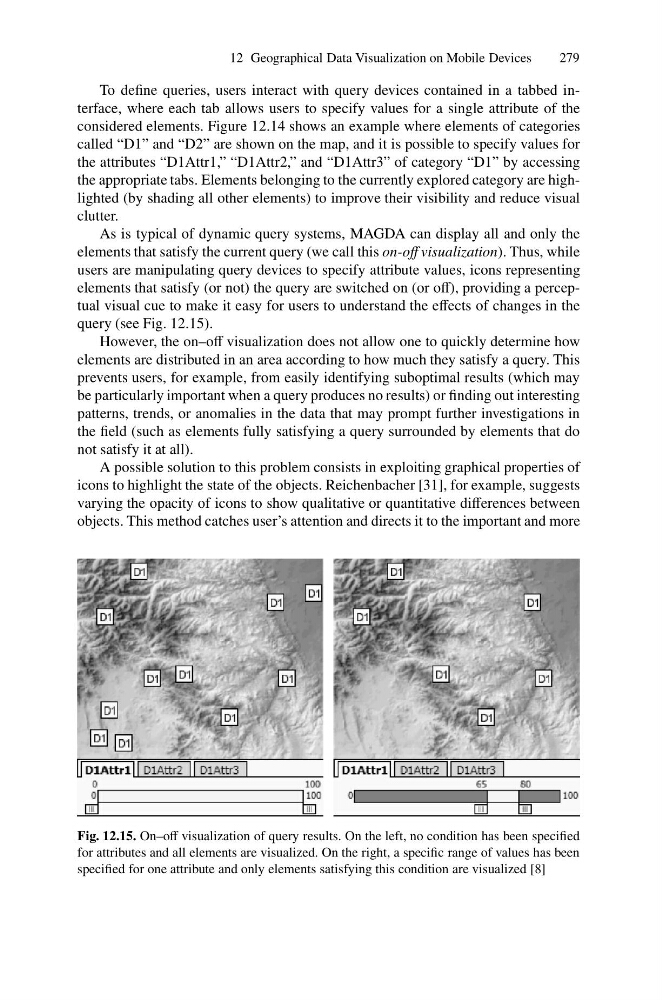
As is typical of dynamic query systems, MAGDA can display all and only the
elements that satisfy the current query (we call this on-off visualization). Thus, while
users are manipulating query devices to specify attribute values, icons representing
elements that satisfy (or not) the query are switched on (or off), providing a perceptual visual cue to make it easy for users to understand the effects of changes in the
query (see Fig. 12.15).
However, the on–off visualization does not allow one to quickly determine how
elements are distributed in an area according to how much they satisfy a query. This
prevents users, for example, from easily identifying suboptimal results (which may
be particularly important when a query produces no results) or finding out interesting
patterns, trends, or anomalies in the data that may prompt further investigations in
the field (such as elements fully satisfying a query surrounded by elements that do
not satisfy it at all).
A possible solution to this problem consists in exploiting graphical properties of
icons to highlight the state of the objects. Reichenbacher [31], for example, suggests
varying the opacity of icons to show qualitative or quantitative differences between
objects. This method catches user’s attention and directs it to the important and more
Fig. 12.15. On–off visualization of query results. On the left, no condition has been specified
for attributes and all elements are visualized. On the right, a specific range of values has been
specified for one attribute and only elements satisfying this condition are visualized [8]
279
To define queries, users interact with query devices contained in a tabbed interface, where each tab allows users to specify values for a single attribute of the
considered elements. Figure 12.14 shows an example where elements of categories
called “D1” and “D2” are shown on the map, and it is possible to specify values for
the attributes “D1Attr1,” “D1Attr2,” and “D1Attr3” of category “D1” by accessing
the appropriate tabs. Elements belonging to the currently explored category are highlighted (by shading all other elements) to improve their visibility and reduce visual
clutter.
As is typical of dynamic query systems, MAGDA can display all and only the
elements that satisfy the current query (we call this on-off visualization). Thus, while
users are manipulating query devices to specify attribute values, icons representing
elements that satisfy (or not) the query are switched on (or off), providing a perceptual visual cue to make it easy for users to understand the effects of changes in the
query (see Fig. 12.15).
However, the on–off visualization does not allow one to quickly determine how
elements are distributed in an area according to how much they satisfy a query. This
prevents users, for example, from easily identifying suboptimal results (which may
be particularly important when a query produces no results) or finding out interesting
patterns, trends, or anomalies in the data that may prompt further investigations in
the field (such as elements fully satisfying a query surrounded by elements that do
not satisfy it at all).
A possible solution to this problem consists in exploiting graphical properties of
icons to highlight the state of the objects. Reichenbacher [31], for example, suggests
varying the opacity of icons to show qualitative or quantitative differences between
objects. This method catches user’s attention and directs it to the important and more
Fig. 12.15. On–off visualization of query results. On the left, no condition has been specified
for attributes and all elements are visualized. On the right, a specific range of values has been
specified for one attribute and only elements satisfying this condition are visualized [8]