

278
Stefano Burigat and Luca Chittaro
information such as the building’s name in a schematic view. The user can paint
points, lines, and arbitrary polygons on the display, and use these primitives as input
to queries. For example, the user can draw two polygonal regions to find buildings
contained within their intersection. User’s location obtained from GPS can also be
used as input to queries, for example to locate the nearest metro stop and telephone
at the end of a path, highlighting buildings close to the user’s path.
In [8], we have presented an application, called “mobile analysis of geographic
data” (MAGDA), aimed at supporting users in the analysis of georeferenced data
on PDAs. The approach we followed is based on exploiting dynamic queries [3, 35]
that are typically used in desktop scenarios to explore large data sets, providing users
with a fast and easy-to-use method to specify queries and visually analyze their results. The basic idea of dynamic queries is to combine input widgets (called “query
devices” [2]), such as sliders or check buttons, with graphical representations of results, such as maps. By directly manipulating query devices, users can specify the
desired values for the attributes of elements in a data set and can easily get different
subsets of the data. Visual results have to be rapidly updated to enable users to learn
interesting properties of the data set as they play with the query devices.
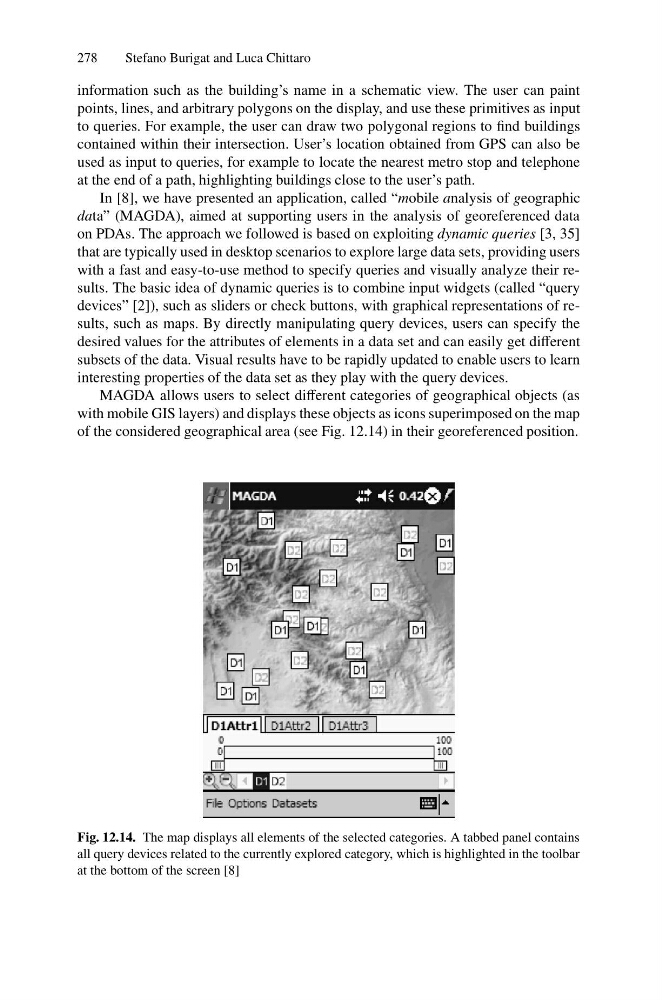
MAGDA allows users to select different categories of geographical objects (as
with mobile GIS layers) and displays these objects as icons superimposed on the map
of the considered geographical area (see Fig. 12.14) in their georeferenced position.
Fig. 12.14. The map displays all elements of the selected categories. A tabbed panel contains
all query devices related to the currently explored category, which is highlighted in the toolbar
at the bottom of the screen [8]
Stefano Burigat and Luca Chittaro
information such as the building’s name in a schematic view. The user can paint
points, lines, and arbitrary polygons on the display, and use these primitives as input
to queries. For example, the user can draw two polygonal regions to find buildings
contained within their intersection. User’s location obtained from GPS can also be
used as input to queries, for example to locate the nearest metro stop and telephone
at the end of a path, highlighting buildings close to the user’s path.
In [8], we have presented an application, called “mobile analysis of geographic
data” (MAGDA), aimed at supporting users in the analysis of georeferenced data
on PDAs. The approach we followed is based on exploiting dynamic queries [3, 35]
that are typically used in desktop scenarios to explore large data sets, providing users
with a fast and easy-to-use method to specify queries and visually analyze their results. The basic idea of dynamic queries is to combine input widgets (called “query
devices” [2]), such as sliders or check buttons, with graphical representations of results, such as maps. By directly manipulating query devices, users can specify the
desired values for the attributes of elements in a data set and can easily get different
subsets of the data. Visual results have to be rapidly updated to enable users to learn
interesting properties of the data set as they play with the query devices.
MAGDA allows users to select different categories of geographical objects (as
with mobile GIS layers) and displays these objects as icons superimposed on the map
of the considered geographical area (see Fig. 12.14) in their georeferenced position.
Fig. 12.14. The map displays all elements of the selected categories. A tabbed panel contains
all query devices related to the currently explored category, which is highlighted in the toolbar
at the bottom of the screen [8]