

12 Geographical Data Visualization on Mobile Devices
277
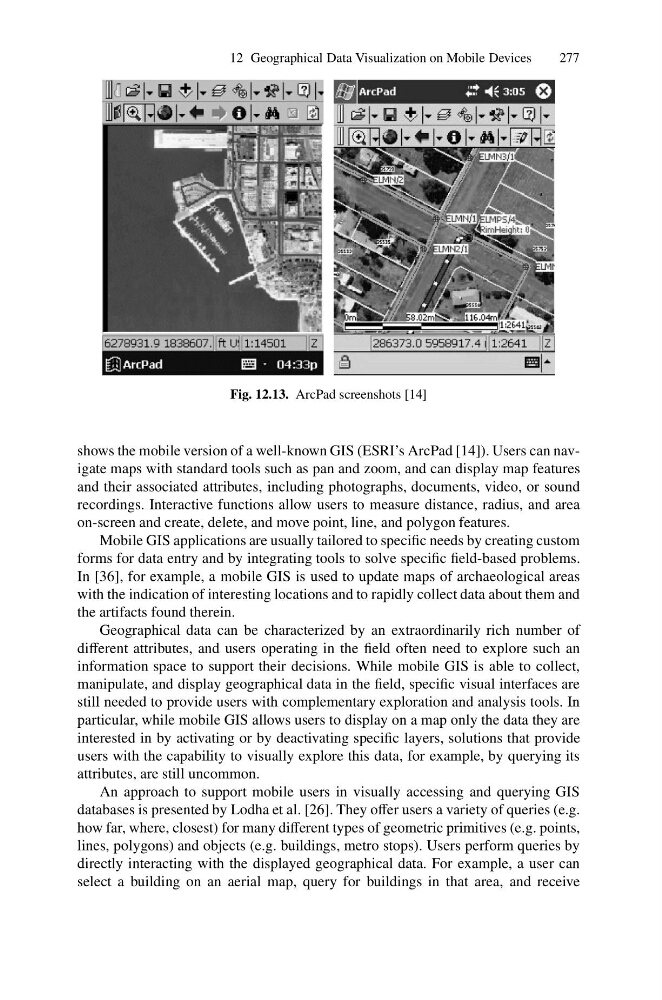
Fig. 12.13. ArcPad screenshots [14]
shows the mobile version of a well-known GIS (ESRI’s ArcPad [14]). Users can navigate maps with standard tools such as pan and zoom, and can display map features
and their associated attributes, including photographs, documents, video, or sound
recordings. Interactive functions allow users to measure distance, radius, and area
on-screen and create, delete, and move point, line, and polygon features.
Mobile GIS applications are usually tailored to specific needs by creating custom
forms for data entry and by integrating tools to solve specific field-based problems.
In [36], for example, a mobile GIS is used to update maps of archaeological areas
with the indication of interesting locations and to rapidly collect data about them and
the artifacts found therein.
Geographical data can be characterized by an extraordinarily rich number of
different attributes, and users operating in the field often need to explore such an
information space to support their decisions. While mobile GIS is able to collect,
manipulate, and display geographical data in the field, specific visual interfaces are
still needed to provide users with complementary exploration and analysis tools. In
particular, while mobile GIS allows users to display on a map only the data they are
interested in by activating or by deactivating specific layers, solutions that provide
users with the capability to visually explore this data, for example, by querying its
attributes, are still uncommon.
An approach to support mobile users in visually accessing and querying GIS
databases is presented by Lodha et al. [26]. They offer users a variety of queries (e.g.
how far, where, closest) for many different types of geometric primitives (e.g. points,
lines, polygons) and objects (e.g. buildings, metro stops). Users perform queries by
directly interacting with the displayed geographical data. For example, a user can
select a building on an aerial map, query for buildings in that area, and receive
277
Fig. 12.13. ArcPad screenshots [14]
shows the mobile version of a well-known GIS (ESRI’s ArcPad [14]). Users can navigate maps with standard tools such as pan and zoom, and can display map features
and their associated attributes, including photographs, documents, video, or sound
recordings. Interactive functions allow users to measure distance, radius, and area
on-screen and create, delete, and move point, line, and polygon features.
Mobile GIS applications are usually tailored to specific needs by creating custom
forms for data entry and by integrating tools to solve specific field-based problems.
In [36], for example, a mobile GIS is used to update maps of archaeological areas
with the indication of interesting locations and to rapidly collect data about them and
the artifacts found therein.
Geographical data can be characterized by an extraordinarily rich number of
different attributes, and users operating in the field often need to explore such an
information space to support their decisions. While mobile GIS is able to collect,
manipulate, and display geographical data in the field, specific visual interfaces are
still needed to provide users with complementary exploration and analysis tools. In
particular, while mobile GIS allows users to display on a map only the data they are
interested in by activating or by deactivating specific layers, solutions that provide
users with the capability to visually explore this data, for example, by querying its
attributes, are still uncommon.
An approach to support mobile users in visually accessing and querying GIS
databases is presented by Lodha et al. [26]. They offer users a variety of queries (e.g.
how far, where, closest) for many different types of geometric primitives (e.g. points,
lines, polygons) and objects (e.g. buildings, metro stops). Users perform queries by
directly interacting with the displayed geographical data. For example, a user can
select a building on an aerial map, query for buildings in that area, and receive