

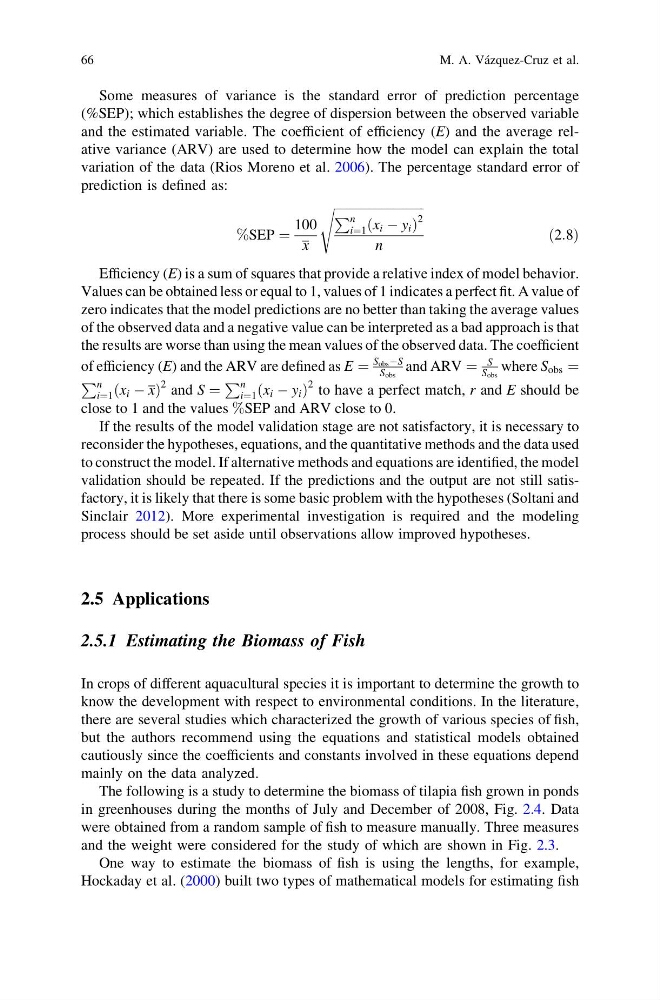
Some measures of variance is the standard error of prediction percentage
(%SEP); which establishes the degree of dispersion between the observed variable
and the estimated variable. The coefficient of efficiency (E) and the average relative variance (ARV) are used to determine how the model can explain the total
variation of the data (Rios Moreno et al. 2006). The percentage standard error of
prediction is defined as:
%SEP ¼
100
x
ffiffiffiffiffiffiffiffiffiffiffiffiffiffiffiffiffiffiffiffiffiffiffiffiffiffiffiffiffi
P n
i¼1 x i À y i
ð
Þ
2
n
s
ð2:8Þ
Efficiency (E) is a sum of squares that provide a relative index of model behavior.
Values can be obtained less or equal to 1, values of 1 indicates a perfect fit. A value of
zero indicates that the model predictions are no better than taking the average values
of the observed data and a negative value can be interpreted as a bad approach is that
the results are worse than using the mean values of the observed data. The coefficient
of efficiency (E) and the ARV are defined as E ¼
S obs ÀS
S obs
and ARV ¼
S
S obs
where S obs ¼
P n
i¼1 x i À x
ð
Þ
2 and S ¼
P n
i¼1 x i À y i
ð
Þ
2 to have a perfect match, r and E should be
close to 1 and the values %SEP and ARV close to 0.
If the results of the model validation stage are not satisfactory, it is necessary to
reconsider the hypotheses, equations, and the quantitative methods and the data used
to construct the model. If alternative methods and equations are identified, the model
validation should be repeated. If the predictions and the output are not still satisfactory, it is likely that there is some basic problem with the hypotheses (Soltani and
Sinclair 2012). More experimental investigation is required and the modeling
process should be set aside until observations allow improved hypotheses.
2.5 Applications
2.5.1 Estimating the Biomass of Fish
In crops of different aquacultural species it is important to determine the growth to
know the development with respect to environmental conditions. In the literature,
there are several studies which characterized the growth of various species of fish,
but the authors recommend using the equations and statistical models obtained
cautiously since the coefficients and constants involved in these equations depend
mainly on the data analyzed.
The following is a study to determine the biomass of tilapia fish grown in ponds
in greenhouses during the months of July and December of 2008, Fig. 2.4. Data
were obtained from a random sample of fish to measure manually. Three measures
and the weight were considered for the study of which are shown in Fig. 2.3.
One way to estimate the biomass of fish is using the lengths, for example,
Hockaday et al. (2000) built two types of mathematical models for estimating fish
66
M. A. Vázquez-Cruz et al.
(%SEP); which establishes the degree of dispersion between the observed variable
and the estimated variable. The coefficient of efficiency (E) and the average relative variance (ARV) are used to determine how the model can explain the total
variation of the data (Rios Moreno et al. 2006). The percentage standard error of
prediction is defined as:
%SEP ¼
100
x
ffiffiffiffiffiffiffiffiffiffiffiffiffiffiffiffiffiffiffiffiffiffiffiffiffiffiffiffiffi
P n
i¼1 x i À y i
ð
Þ
2
n
s
ð2:8Þ
Efficiency (E) is a sum of squares that provide a relative index of model behavior.
Values can be obtained less or equal to 1, values of 1 indicates a perfect fit. A value of
zero indicates that the model predictions are no better than taking the average values
of the observed data and a negative value can be interpreted as a bad approach is that
the results are worse than using the mean values of the observed data. The coefficient
of efficiency (E) and the ARV are defined as E ¼
S obs ÀS
S obs
and ARV ¼
S
S obs
where S obs ¼
P n
i¼1 x i À x
ð
Þ
2 and S ¼
P n
i¼1 x i À y i
ð
Þ
2 to have a perfect match, r and E should be
close to 1 and the values %SEP and ARV close to 0.
If the results of the model validation stage are not satisfactory, it is necessary to
reconsider the hypotheses, equations, and the quantitative methods and the data used
to construct the model. If alternative methods and equations are identified, the model
validation should be repeated. If the predictions and the output are not still satisfactory, it is likely that there is some basic problem with the hypotheses (Soltani and
Sinclair 2012). More experimental investigation is required and the modeling
process should be set aside until observations allow improved hypotheses.
2.5 Applications
2.5.1 Estimating the Biomass of Fish
In crops of different aquacultural species it is important to determine the growth to
know the development with respect to environmental conditions. In the literature,
there are several studies which characterized the growth of various species of fish,
but the authors recommend using the equations and statistical models obtained
cautiously since the coefficients and constants involved in these equations depend
mainly on the data analyzed.
The following is a study to determine the biomass of tilapia fish grown in ponds
in greenhouses during the months of July and December of 2008, Fig. 2.4. Data
were obtained from a random sample of fish to measure manually. Three measures
and the weight were considered for the study of which are shown in Fig. 2.3.
One way to estimate the biomass of fish is using the lengths, for example,
Hockaday et al. (2000) built two types of mathematical models for estimating fish
66
M. A. Vázquez-Cruz et al.