

biomass tilapia, first using least squares regression and through ANNs, these
models are based on data on different lengths of fish. Another example is the
research of Lines et al. (2001), which a system based on image analysis to estimate
the mass of the salmon is proposed. The system was developed and tested under
certain conditions. As well, Martínez et al. (2002) proposed a relation length–
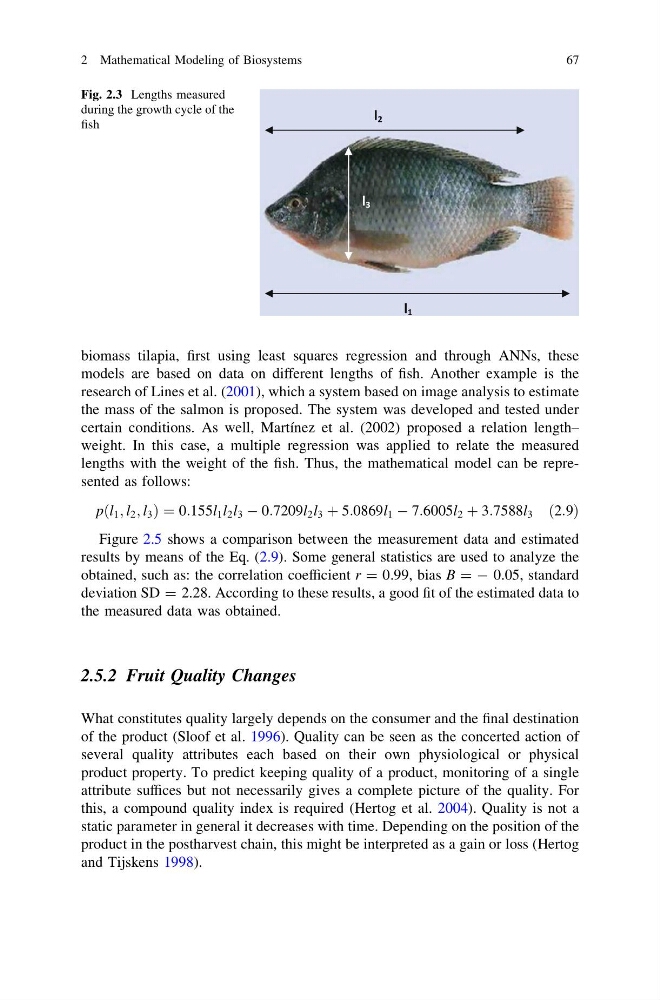
weight. In this case, a multiple regression was applied to relate the measured
lengths with the weight of the fish. Thus, the mathematical model can be represented as follows:
p l 1 ; l 2 ; l 3
ð
Þ¼0:155l 1 l 2 l 3 À 0:7209l 2 l 3 þ 5:0869l 1 À 7:6005l 2 þ 3:7588l 3 ð2:9Þ
Figure 2.5 shows a comparison between the measurement data and estimated
results by means of the Eq. (2.9). Some general statistics are used to analyze the
obtained, such as: the correlation coefficient r = 0.99, bias B = - 0.05, standard
deviation SD = 2.28. According to these results, a good fit of the estimated data to
the measured data was obtained.
2.5.2 Fruit Quality Changes
What constitutes quality largely depends on the consumer and the final destination
of the product (Sloof et al. 1996). Quality can be seen as the concerted action of
several quality attributes each based on their own physiological or physical
product property. To predict keeping quality of a product, monitoring of a single
attribute suffices but not necessarily gives a complete picture of the quality. For
this, a compound quality index is required (Hertog et al. 2004). Quality is not a
static parameter in general it decreases with time. Depending on the position of the
product in the postharvest chain, this might be interpreted as a gain or loss (Hertog
and Tijskens 1998).
Fig. 2.3 Lengths measured
during the growth cycle of the
fish
2 Mathematical Modeling of Biosystems
67
models are based on data on different lengths of fish. Another example is the
research of Lines et al. (2001), which a system based on image analysis to estimate
the mass of the salmon is proposed. The system was developed and tested under
certain conditions. As well, Martínez et al. (2002) proposed a relation length–
weight. In this case, a multiple regression was applied to relate the measured
lengths with the weight of the fish. Thus, the mathematical model can be represented as follows:
p l 1 ; l 2 ; l 3
ð
Þ¼0:155l 1 l 2 l 3 À 0:7209l 2 l 3 þ 5:0869l 1 À 7:6005l 2 þ 3:7588l 3 ð2:9Þ
Figure 2.5 shows a comparison between the measurement data and estimated
results by means of the Eq. (2.9). Some general statistics are used to analyze the
obtained, such as: the correlation coefficient r = 0.99, bias B = - 0.05, standard
deviation SD = 2.28. According to these results, a good fit of the estimated data to
the measured data was obtained.
2.5.2 Fruit Quality Changes
What constitutes quality largely depends on the consumer and the final destination
of the product (Sloof et al. 1996). Quality can be seen as the concerted action of
several quality attributes each based on their own physiological or physical
product property. To predict keeping quality of a product, monitoring of a single
attribute suffices but not necessarily gives a complete picture of the quality. For
this, a compound quality index is required (Hertog et al. 2004). Quality is not a
static parameter in general it decreases with time. Depending on the position of the
product in the postharvest chain, this might be interpreted as a gain or loss (Hertog
and Tijskens 1998).
Fig. 2.3 Lengths measured
during the growth cycle of the
fish
2 Mathematical Modeling of Biosystems
67