

46
J. Gower and S. King
0
5
10
15
20
25
30
35
40
2002 2003 2004 2005 2006 2007 2008 2009 2010 2011 2012 2013
Start of year
Total MCI signal
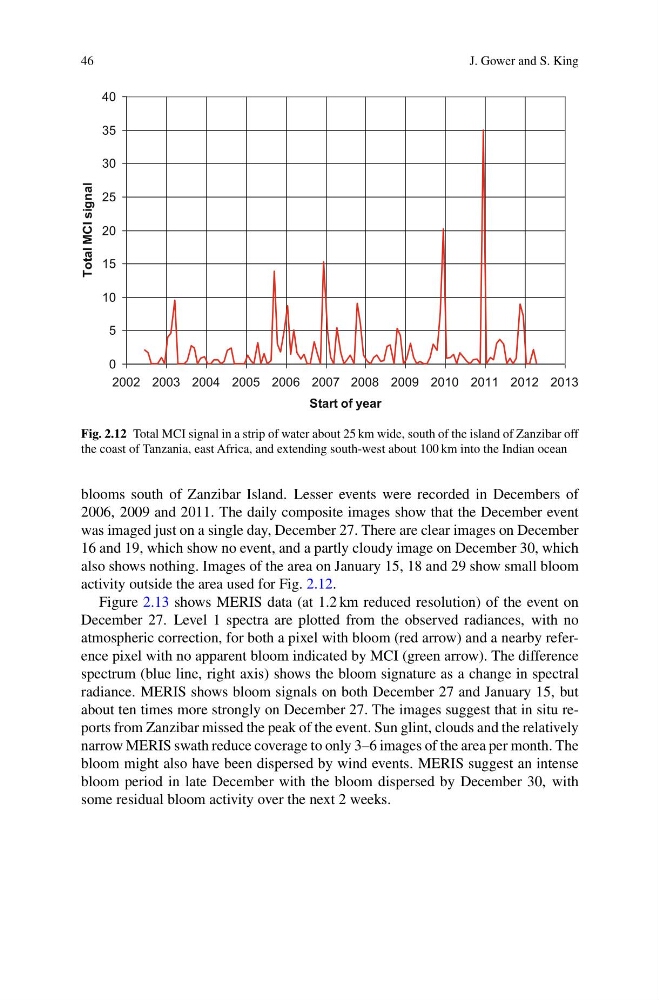
Fig. 2.12 Total MCI signal in a strip of water about 25 km wide, south of the island of Zanzibar off
the coast of Tanzania, east Africa, and extending south-west about 100 km into the Indian ocean
blooms south of Zanzibar Island. Lesser events were recorded in Decembers of
2006, 2009 and 2011. The daily composite images show that the December event
was imaged just on a single day, December 27. There are clear images on December
16 and 19, which show no event, and a partly cloudy image on December 30, which
also shows nothing. Images of the area on January 15, 18 and 29 show small bloom
activity outside the area used for Fig. 2.12.
Figure 2.13 shows MERIS data (at 1.2 km reduced resolution) of the event on
December 27. Level 1 spectra are plotted from the observed radiances, with no
atmospheric correction, for both a pixel with bloom (red arrow) and a nearby reference pixel with no apparent bloom indicated by MCI (green arrow). The difference
spectrum (blue line, right axis) shows the bloom signature as a change in spectral
radiance. MERIS shows bloom signals on both December 27 and January 15, but
about ten times more strongly on December 27. The images suggest that in situ reports from Zanzibar missed the peak of the event. Sun glint, clouds and the relatively
narrow MERIS swath reduce coverage to only 3–6 images of the area per month. The
bloom might also have been dispersed by wind events. MERIS suggest an intense
bloom period in late December with the bloom dispersed by December 30, with
some residual bloom activity over the next 2 weeks.
J. Gower and S. King
0
5
10
15
20
25
30
35
40
2002 2003 2004 2005 2006 2007 2008 2009 2010 2011 2012 2013
Start of year
Total MCI signal
Fig. 2.12 Total MCI signal in a strip of water about 25 km wide, south of the island of Zanzibar off
the coast of Tanzania, east Africa, and extending south-west about 100 km into the Indian ocean
blooms south of Zanzibar Island. Lesser events were recorded in Decembers of
2006, 2009 and 2011. The daily composite images show that the December event
was imaged just on a single day, December 27. There are clear images on December
16 and 19, which show no event, and a partly cloudy image on December 30, which
also shows nothing. Images of the area on January 15, 18 and 29 show small bloom
activity outside the area used for Fig. 2.12.
Figure 2.13 shows MERIS data (at 1.2 km reduced resolution) of the event on
December 27. Level 1 spectra are plotted from the observed radiances, with no
atmospheric correction, for both a pixel with bloom (red arrow) and a nearby reference pixel with no apparent bloom indicated by MCI (green arrow). The difference
spectrum (blue line, right axis) shows the bloom signature as a change in spectral
radiance. MERIS shows bloom signals on both December 27 and January 15, but
about ten times more strongly on December 27. The images suggest that in situ reports from Zanzibar missed the peak of the event. Sun glint, clouds and the relatively
narrow MERIS swath reduce coverage to only 3–6 images of the area per month. The
bloom might also have been dispersed by wind events. MERIS suggest an intense
bloom period in late December with the bloom dispersed by December 30, with
some residual bloom activity over the next 2 weeks.