

2 Satellite Water Colour Observations in African Seas
45
0
500
1000
1500
2000
2500
2002 2003 2004 2005 2006 2007 2008 2009 2010 2011 2012
Start of year
Total MCI signal
0
40000
80000
120000
160000
200000
Clear-sky area (km
2
)
Total MCI
Pixel count
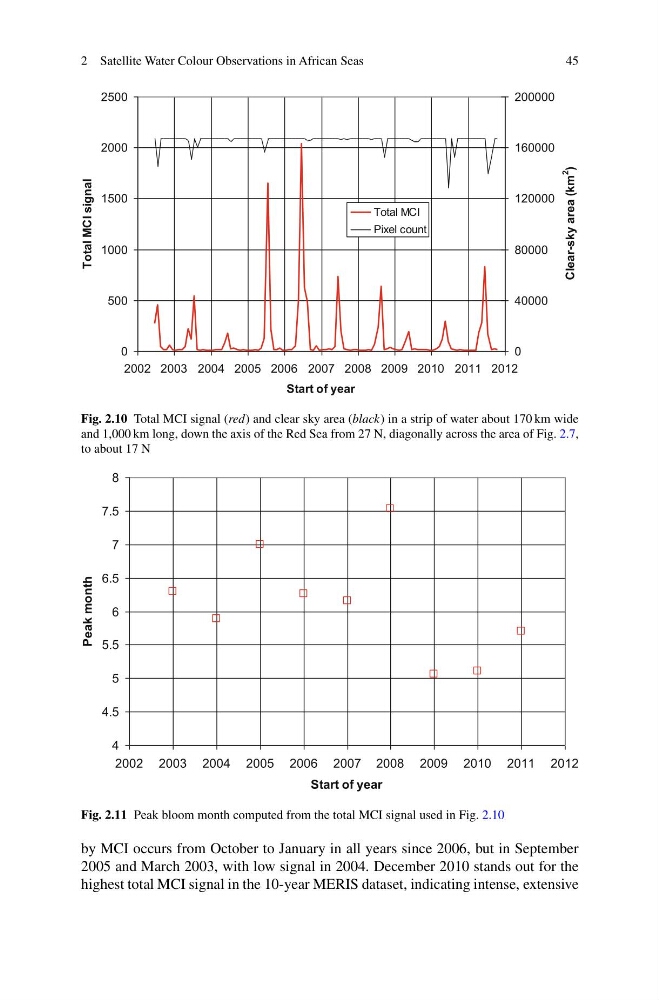
Fig. 2.10 Total MCI signal (red) and clear sky area (black) in a strip of water about 170 km wide
and 1,000 km long, down the axis of the Red Sea from 27 N, diagonally across the area of Fig. 2.7,
to about 17 N
4
4.5
5
5.5
6
6.5
7
7.5
8
2002 2003 2004 2005 2006 2007 2008 2009 2010 2011 2012
Start of year
Peak month
Fig. 2.11 Peak bloom month computed from the total MCI signal used in Fig. 2.10
by MCI occurs from October to January in all years since 2006, but in September
2005 and March 2003, with low signal in 2004. December 2010 stands out for the
highest total MCI signal in the 10-year MERIS dataset, indicating intense, extensive
45
0
500
1000
1500
2000
2500
2002 2003 2004 2005 2006 2007 2008 2009 2010 2011 2012
Start of year
Total MCI signal
0
40000
80000
120000
160000
200000
Clear-sky area (km
2
)
Total MCI
Pixel count
Fig. 2.10 Total MCI signal (red) and clear sky area (black) in a strip of water about 170 km wide
and 1,000 km long, down the axis of the Red Sea from 27 N, diagonally across the area of Fig. 2.7,
to about 17 N
4
4.5
5
5.5
6
6.5
7
7.5
8
2002 2003 2004 2005 2006 2007 2008 2009 2010 2011 2012
Start of year
Peak month
Fig. 2.11 Peak bloom month computed from the total MCI signal used in Fig. 2.10
by MCI occurs from October to January in all years since 2006, but in September
2005 and March 2003, with low signal in 2004. December 2010 stands out for the
highest total MCI signal in the 10-year MERIS dataset, indicating intense, extensive