

2 Satellite Water Colour Observations in African Seas
47
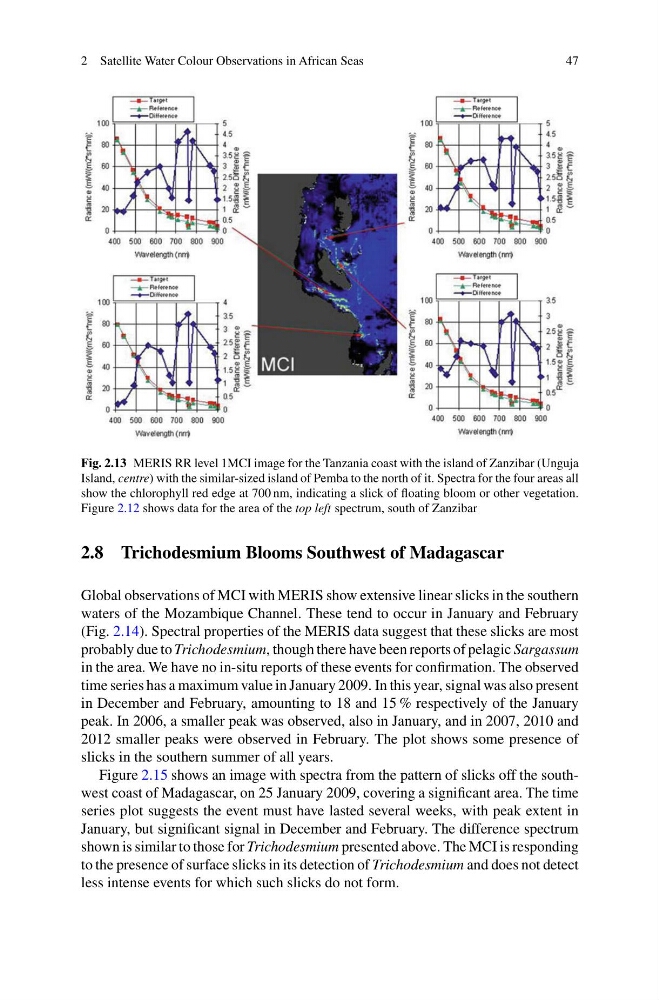
Fig. 2.13 MERIS RR level 1MCI image for the Tanzania coast with the island of Zanzibar (Unguja
Island, centre) with the similar-sized island of Pemba to the north of it. Spectra for the four areas all
show the chlorophyll red edge at 700 nm, indicating a slick of floating bloom or other vegetation.
Figure 2.12 shows data for the area of the top left spectrum, south of Zanzibar
2.8 Trichodesmium Blooms Southwest of Madagascar
Global observations of MCI with MERIS show extensive linear slicks in the southern
waters of the Mozambique Channel. These tend to occur in January and February
(Fig. 2.14). Spectral properties of the MERIS data suggest that these slicks are most
probably due to Trichodesmium, though there have been reports of pelagic Sargassum
in the area. We have no in-situ reports of these events for confirmation. The observed
time series has a maximum value in January 2009. In this year, signal was also present
in December and February, amounting to 18 and 15 % respectively of the January
peak. In 2006, a smaller peak was observed, also in January, and in 2007, 2010 and
2012 smaller peaks were observed in February. The plot shows some presence of
slicks in the southern summer of all years.
Figure 2.15 shows an image with spectra from the pattern of slicks off the southwest coast of Madagascar, on 25 January 2009, covering a significant area. The time
series plot suggests the event must have lasted several weeks, with peak extent in
January, but significant signal in December and February. The difference spectrum
shown is similar to those for Trichodesmium presented above. The MCI is responding
to the presence of surface slicks in its detection of Trichodesmium and does not detect
less intense events for which such slicks do not form.
47
Fig. 2.13 MERIS RR level 1MCI image for the Tanzania coast with the island of Zanzibar (Unguja
Island, centre) with the similar-sized island of Pemba to the north of it. Spectra for the four areas all
show the chlorophyll red edge at 700 nm, indicating a slick of floating bloom or other vegetation.
Figure 2.12 shows data for the area of the top left spectrum, south of Zanzibar
2.8 Trichodesmium Blooms Southwest of Madagascar
Global observations of MCI with MERIS show extensive linear slicks in the southern
waters of the Mozambique Channel. These tend to occur in January and February
(Fig. 2.14). Spectral properties of the MERIS data suggest that these slicks are most
probably due to Trichodesmium, though there have been reports of pelagic Sargassum
in the area. We have no in-situ reports of these events for confirmation. The observed
time series has a maximum value in January 2009. In this year, signal was also present
in December and February, amounting to 18 and 15 % respectively of the January
peak. In 2006, a smaller peak was observed, also in January, and in 2007, 2010 and
2012 smaller peaks were observed in February. The plot shows some presence of
slicks in the southern summer of all years.
Figure 2.15 shows an image with spectra from the pattern of slicks off the southwest coast of Madagascar, on 25 January 2009, covering a significant area. The time
series plot suggests the event must have lasted several weeks, with peak extent in
January, but significant signal in December and February. The difference spectrum
shown is similar to those for Trichodesmium presented above. The MCI is responding
to the presence of surface slicks in its detection of Trichodesmium and does not detect
less intense events for which such slicks do not form.