

42
J. Gower and S. King
0
0.2
0.4
0.6
0.8
1
1.2
2002 2003 2004 2005 2006 2007 2008 2009 2010 2011 2012 2013
Start of year
Chlor (mg.m
-3
)
0
0.004
0.008
0.012
0.016
0.02
0.024
FLH / NFLH (mW.cm
-2
.m
-1
.ster
-1
)
Chlor
FLH
NFLH
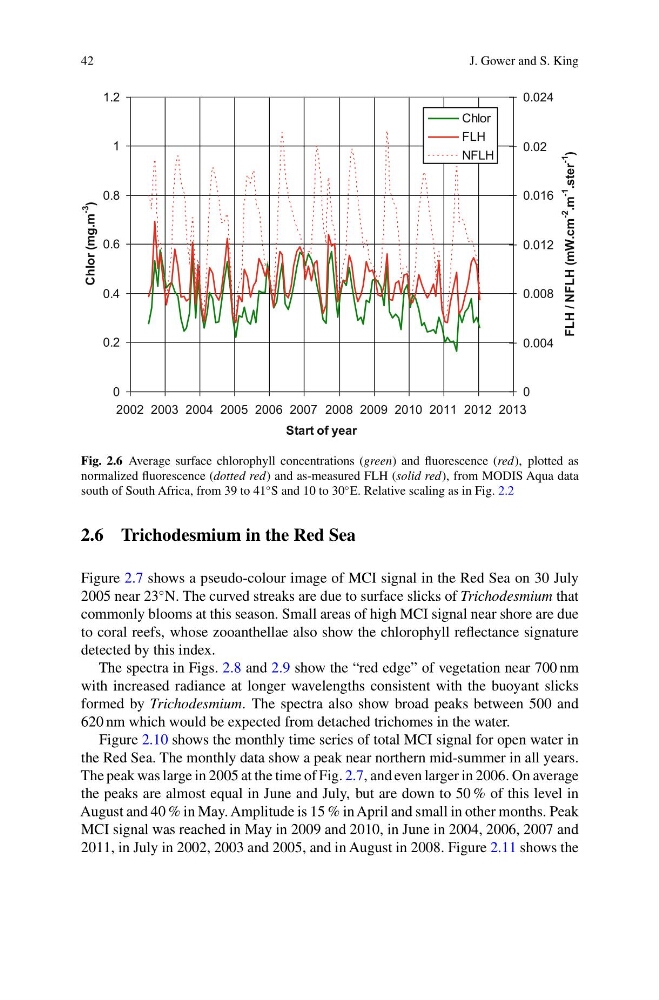
Fig. 2.6 Average surface chlorophyll concentrations (green) and fluorescence (red), plotted as
normalized fluorescence (dotted red) and as-measured FLH (solid red), from MODIS Aqua data
south of South Africa, from 39 to 41
◦ S and 10 to 30
◦ E. Relative scaling as in Fig. 2.2
2.6 Trichodesmium in the Red Sea
Figure 2.7 shows a pseudo-colour image of MCI signal in the Red Sea on 30 July
2005 near 23
◦ N. The curved streaks are due to surface slicks of Trichodesmium that
commonly blooms at this season. Small areas of high MCI signal near shore are due
to coral reefs, whose zooanthellae also show the chlorophyll reflectance signature
detected by this index.
The spectra in Figs. 2.8 and 2.9 show the “red edge” of vegetation near 700 nm
with increased radiance at longer wavelengths consistent with the buoyant slicks
formed by Trichodesmium. The spectra also show broad peaks between 500 and
620 nm which would be expected from detached trichomes in the water.
Figure 2.10 shows the monthly time series of total MCI signal for open water in
the Red Sea. The monthly data show a peak near northern mid-summer in all years.
The peak was large in 2005 at the time of Fig. 2.7, and even larger in 2006. On average
the peaks are almost equal in June and July, but are down to 50 % of this level in
August and 40 % in May. Amplitude is 15 % in April and small in other months. Peak
MCI signal was reached in May in 2009 and 2010, in June in 2004, 2006, 2007 and
2011, in July in 2002, 2003 and 2005, and in August in 2008. Figure 2.11 shows the
J. Gower and S. King
0
0.2
0.4
0.6
0.8
1
1.2
2002 2003 2004 2005 2006 2007 2008 2009 2010 2011 2012 2013
Start of year
Chlor (mg.m
-3
)
0
0.004
0.008
0.012
0.016
0.02
0.024
FLH / NFLH (mW.cm
-2
.m
-1
.ster
-1
)
Chlor
FLH
NFLH
Fig. 2.6 Average surface chlorophyll concentrations (green) and fluorescence (red), plotted as
normalized fluorescence (dotted red) and as-measured FLH (solid red), from MODIS Aqua data
south of South Africa, from 39 to 41
◦ S and 10 to 30
◦ E. Relative scaling as in Fig. 2.2
2.6 Trichodesmium in the Red Sea
Figure 2.7 shows a pseudo-colour image of MCI signal in the Red Sea on 30 July
2005 near 23
◦ N. The curved streaks are due to surface slicks of Trichodesmium that
commonly blooms at this season. Small areas of high MCI signal near shore are due
to coral reefs, whose zooanthellae also show the chlorophyll reflectance signature
detected by this index.
The spectra in Figs. 2.8 and 2.9 show the “red edge” of vegetation near 700 nm
with increased radiance at longer wavelengths consistent with the buoyant slicks
formed by Trichodesmium. The spectra also show broad peaks between 500 and
620 nm which would be expected from detached trichomes in the water.
Figure 2.10 shows the monthly time series of total MCI signal for open water in
the Red Sea. The monthly data show a peak near northern mid-summer in all years.
The peak was large in 2005 at the time of Fig. 2.7, and even larger in 2006. On average
the peaks are almost equal in June and July, but are down to 50 % of this level in
August and 40 % in May. Amplitude is 15 % in April and small in other months. Peak
MCI signal was reached in May in 2009 and 2010, in June in 2004, 2006, 2007 and
2011, in July in 2002, 2003 and 2005, and in August in 2008. Figure 2.11 shows the