

2 Satellite Water Colour Observations in African Seas
43
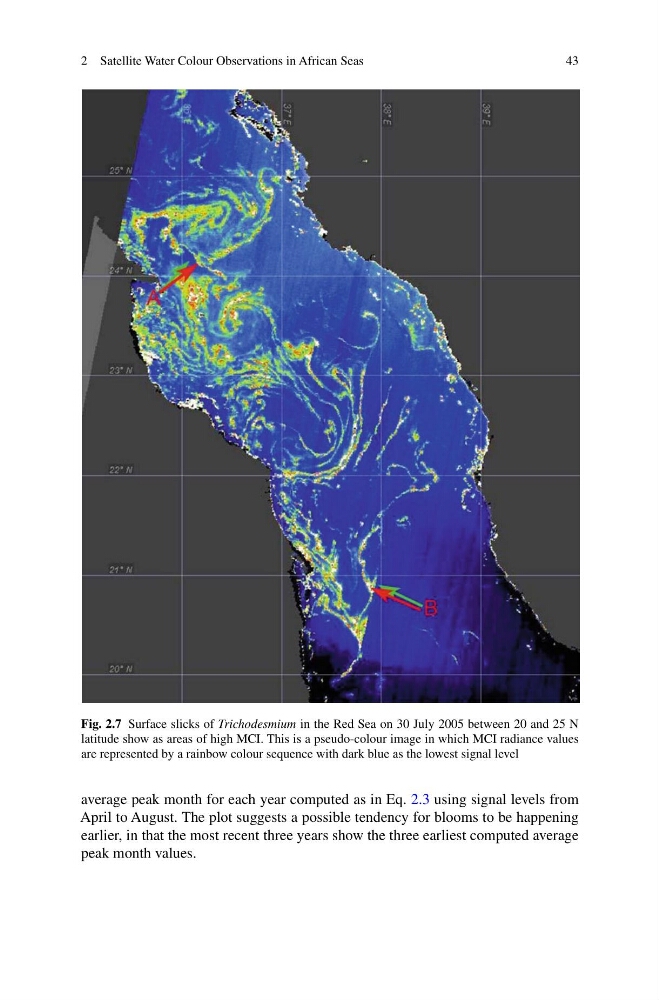
Fig. 2.7 Surface slicks of Trichodesmium in the Red Sea on 30 July 2005 between 20 and 25 N
latitude show as areas of high MCI. This is a pseudo-colour image in which MCI radiance values
are represented by a rainbow colour sequence with dark blue as the lowest signal level
average peak month for each year computed as in Eq. 2.3 using signal levels from
April to August. The plot suggests a possible tendency for blooms to be happening
earlier, in that the most recent three years show the three earliest computed average
peak month values.
43
Fig. 2.7 Surface slicks of Trichodesmium in the Red Sea on 30 July 2005 between 20 and 25 N
latitude show as areas of high MCI. This is a pseudo-colour image in which MCI radiance values
are represented by a rainbow colour sequence with dark blue as the lowest signal level
average peak month for each year computed as in Eq. 2.3 using signal levels from
April to August. The plot suggests a possible tendency for blooms to be happening
earlier, in that the most recent three years show the three earliest computed average
peak month values.