

2 Satellite Water Colour Observations in African Seas
41
0
1
2
3
4
5
6
7
8
2002 2003 2004 2005 2006 2007 2008 2009 2010 2011 2012 2013
Start of year
Chlor (mg.m3
)
0
0.02
0.04
0.06
0.08
0.1
0.12
0.14
0.16
FLH / NFLH (mW.cm
-2
.
-1
.ster
-1
)
Chlor
Chlor'
NFLH
FLH
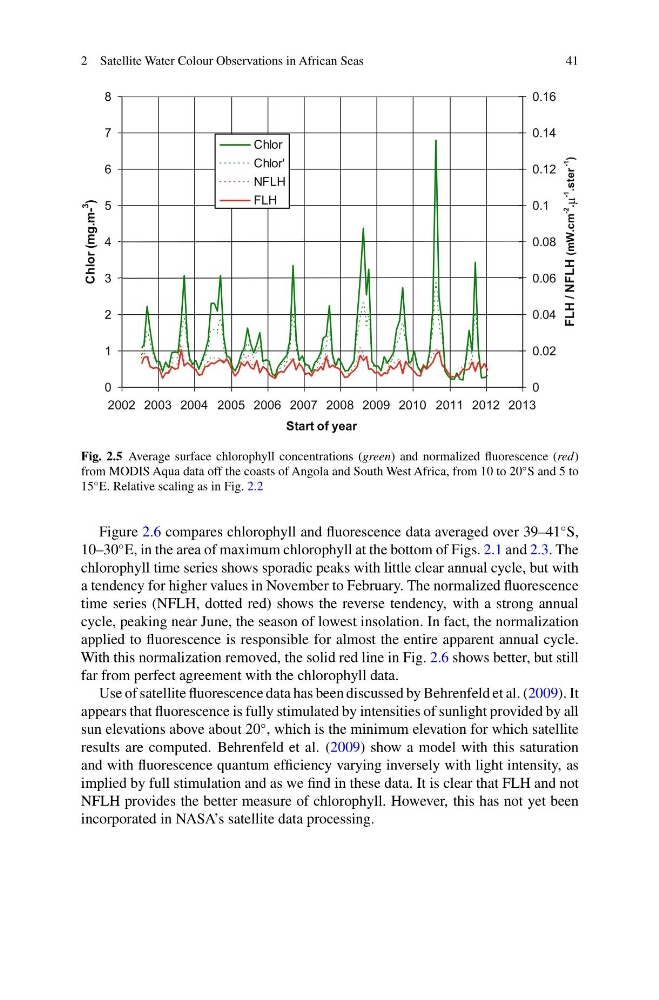
Fig. 2.5 Average surface chlorophyll concentrations (green) and normalized fluorescence (red)
from MODIS Aqua data off the coasts of Angola and South West Africa, from 10 to 20
◦ S and 5 to
15
◦ E. Relative scaling as in Fig. 2.2
Figure 2.6 compares chlorophyll and fluorescence data averaged over 39–41
◦ S,
10–30
◦ E, in the area of maximum chlorophyll at the bottom of Figs. 2.1 and 2.3. The
chlorophyll time series shows sporadic peaks with little clear annual cycle, but with
a tendency for higher values in November to February. The normalized fluorescence
time series (NFLH, dotted red) shows the reverse tendency, with a strong annual
cycle, peaking near June, the season of lowest insolation. In fact, the normalization
applied to fluorescence is responsible for almost the entire apparent annual cycle.
With this normalization removed, the solid red line in Fig. 2.6 shows better, but still
far from perfect agreement with the chlorophyll data.
Use of satellite fluorescence data has been discussed by Behrenfeld et al. (2009). It
appears that fluorescence is fully stimulated by intensities of sunlight provided by all
sun elevations above about 20
◦ , which is the minimum elevation for which satellite
results are computed. Behrenfeld et al. (2009) show a model with this saturation
and with fluorescence quantum efficiency varying inversely with light intensity, as
implied by full stimulation and as we find in these data. It is clear that FLH and not
NFLH provides the better measure of chlorophyll. However, this has not yet been
incorporated in NASA’s satellite data processing.
41
0
1
2
3
4
5
6
7
8
2002 2003 2004 2005 2006 2007 2008 2009 2010 2011 2012 2013
Start of year
Chlor (mg.m3
)
0
0.02
0.04
0.06
0.08
0.1
0.12
0.14
0.16
FLH / NFLH (mW.cm
-2
.
-1
.ster
-1
)
Chlor
Chlor'
NFLH
FLH
Fig. 2.5 Average surface chlorophyll concentrations (green) and normalized fluorescence (red)
from MODIS Aqua data off the coasts of Angola and South West Africa, from 10 to 20
◦ S and 5 to
15
◦ E. Relative scaling as in Fig. 2.2
Figure 2.6 compares chlorophyll and fluorescence data averaged over 39–41
◦ S,
10–30
◦ E, in the area of maximum chlorophyll at the bottom of Figs. 2.1 and 2.3. The
chlorophyll time series shows sporadic peaks with little clear annual cycle, but with
a tendency for higher values in November to February. The normalized fluorescence
time series (NFLH, dotted red) shows the reverse tendency, with a strong annual
cycle, peaking near June, the season of lowest insolation. In fact, the normalization
applied to fluorescence is responsible for almost the entire apparent annual cycle.
With this normalization removed, the solid red line in Fig. 2.6 shows better, but still
far from perfect agreement with the chlorophyll data.
Use of satellite fluorescence data has been discussed by Behrenfeld et al. (2009). It
appears that fluorescence is fully stimulated by intensities of sunlight provided by all
sun elevations above about 20
◦ , which is the minimum elevation for which satellite
results are computed. Behrenfeld et al. (2009) show a model with this saturation
and with fluorescence quantum efficiency varying inversely with light intensity, as
implied by full stimulation and as we find in these data. It is clear that FLH and not
NFLH provides the better measure of chlorophyll. However, this has not yet been
incorporated in NASA’s satellite data processing.