

40
J. Gower and S. King
0
0.5
1
1.5
2
2.5
3
2002 2003 2004 2005 2006 2007 2008 2009 2010 2011 2012 2013
Start of year
Chlor (mg.m
-3
)
0
0.01
0.02
0.03
0.04
0.05
0.06
NFLH (mW.cm
-2
.
-1
.ster
-1
)
Chlor
Chlor'
NFLH
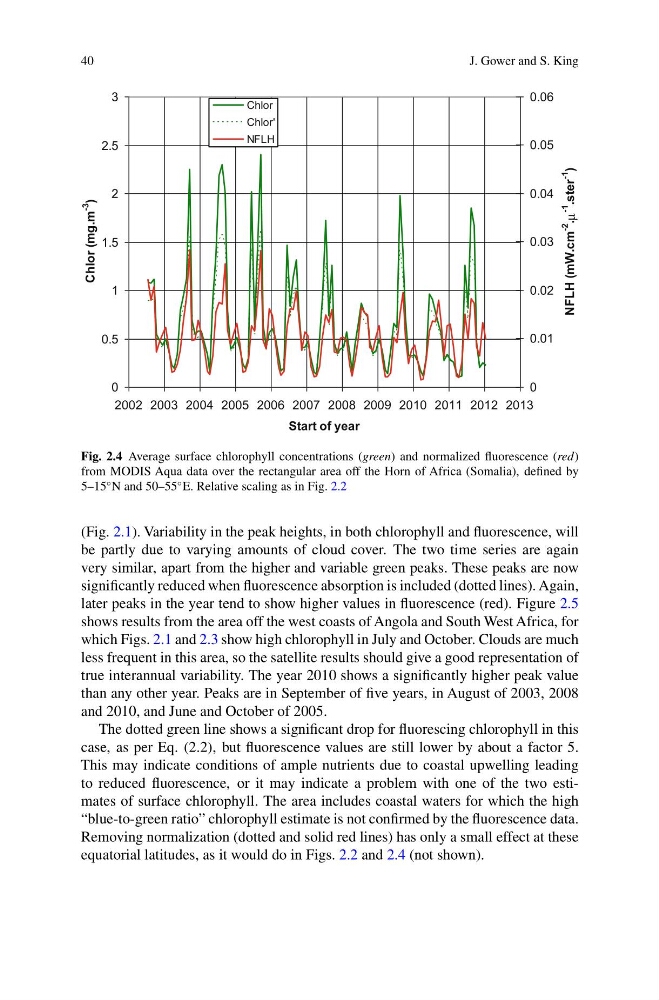
Fig. 2.4 Average surface chlorophyll concentrations (green) and normalized fluorescence (red)
from MODIS Aqua data over the rectangular area off the Horn of Africa (Somalia), defined by
5–15
◦ N and 50–55
◦ E. Relative scaling as in Fig. 2.2
(Fig. 2.1). Variability in the peak heights, in both chlorophyll and fluorescence, will
be partly due to varying amounts of cloud cover. The two time series are again
very similar, apart from the higher and variable green peaks. These peaks are now
significantly reduced when fluorescence absorption is included (dotted lines). Again,
later peaks in the year tend to show higher values in fluorescence (red). Figure 2.5
shows results from the area off the west coasts of Angola and South West Africa, for
which Figs. 2.1 and 2.3 show high chlorophyll in July and October. Clouds are much
less frequent in this area, so the satellite results should give a good representation of
true interannual variability. The year 2010 shows a significantly higher peak value
than any other year. Peaks are in September of five years, in August of 2003, 2008
and 2010, and June and October of 2005.
The dotted green line shows a significant drop for fluorescing chlorophyll in this
case, as per Eq. (2.2), but fluorescence values are still lower by about a factor 5.
This may indicate conditions of ample nutrients due to coastal upwelling leading
to reduced fluorescence, or it may indicate a problem with one of the two estimates of surface chlorophyll. The area includes coastal waters for which the high
“blue-to-green ratio” chlorophyll estimate is not confirmed by the fluorescence data.
Removing normalization (dotted and solid red lines) has only a small effect at these
equatorial latitudes, as it would do in Figs. 2.2 and 2.4 (not shown).
J. Gower and S. King
0
0.5
1
1.5
2
2.5
3
2002 2003 2004 2005 2006 2007 2008 2009 2010 2011 2012 2013
Start of year
Chlor (mg.m
-3
)
0
0.01
0.02
0.03
0.04
0.05
0.06
NFLH (mW.cm
-2
.
-1
.ster
-1
)
Chlor
Chlor'
NFLH
Fig. 2.4 Average surface chlorophyll concentrations (green) and normalized fluorescence (red)
from MODIS Aqua data over the rectangular area off the Horn of Africa (Somalia), defined by
5–15
◦ N and 50–55
◦ E. Relative scaling as in Fig. 2.2
(Fig. 2.1). Variability in the peak heights, in both chlorophyll and fluorescence, will
be partly due to varying amounts of cloud cover. The two time series are again
very similar, apart from the higher and variable green peaks. These peaks are now
significantly reduced when fluorescence absorption is included (dotted lines). Again,
later peaks in the year tend to show higher values in fluorescence (red). Figure 2.5
shows results from the area off the west coasts of Angola and South West Africa, for
which Figs. 2.1 and 2.3 show high chlorophyll in July and October. Clouds are much
less frequent in this area, so the satellite results should give a good representation of
true interannual variability. The year 2010 shows a significantly higher peak value
than any other year. Peaks are in September of five years, in August of 2003, 2008
and 2010, and June and October of 2005.
The dotted green line shows a significant drop for fluorescing chlorophyll in this
case, as per Eq. (2.2), but fluorescence values are still lower by about a factor 5.
This may indicate conditions of ample nutrients due to coastal upwelling leading
to reduced fluorescence, or it may indicate a problem with one of the two estimates of surface chlorophyll. The area includes coastal waters for which the high
“blue-to-green ratio” chlorophyll estimate is not confirmed by the fluorescence data.
Removing normalization (dotted and solid red lines) has only a small effect at these
equatorial latitudes, as it would do in Figs. 2.2 and 2.4 (not shown).