

2 Satellite Water Colour Observations in African Seas
39
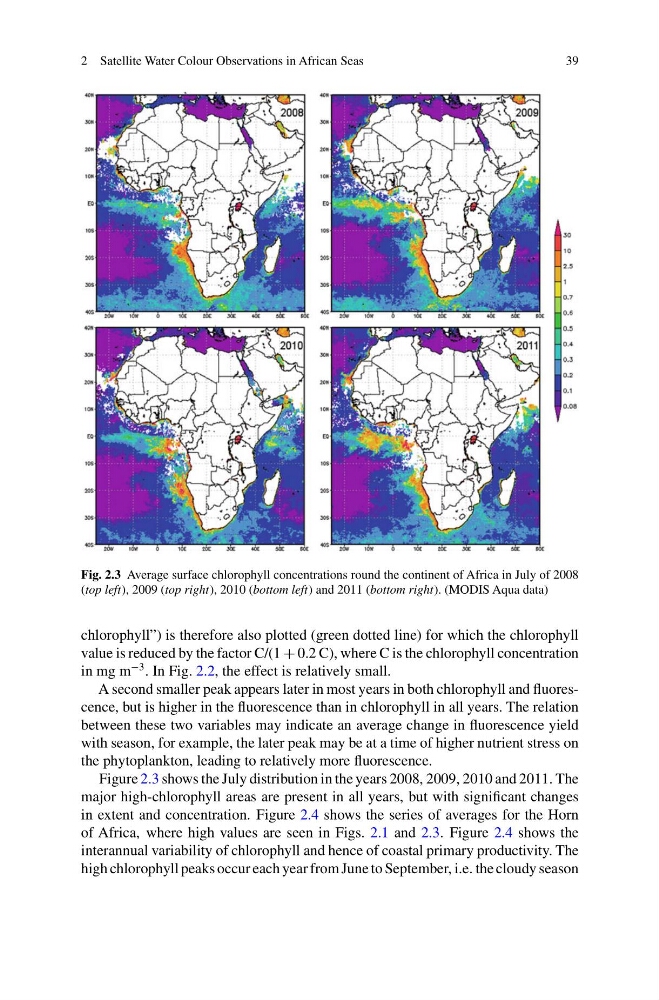
Fig. 2.3 Average surface chlorophyll concentrations round the continent of Africa in July of 2008
(top left), 2009 (top right), 2010 (bottom left) and 2011 (bottom right). (MODIS Aqua data)
chlorophyll”) is therefore also plotted (green dotted line) for which the chlorophyll
value is reduced by the factor C/(1 + 0.2 C), where C is the chlorophyll concentration
in mg m
−3 . In Fig. 2.2, the effect is relatively small.
A second smaller peak appears later in most years in both chlorophyll and fluorescence, but is higher in the fluorescence than in chlorophyll in all years. The relation
between these two variables may indicate an average change in fluorescence yield
with season, for example, the later peak may be at a time of higher nutrient stress on
the phytoplankton, leading to relatively more fluorescence.
Figure 2.3 shows the July distribution in the years 2008, 2009, 2010 and 2011. The
major high-chlorophyll areas are present in all years, but with significant changes
in extent and concentration. Figure 2.4 shows the series of averages for the Horn
of Africa, where high values are seen in Figs. 2.1 and 2.3. Figure 2.4 shows the
interannual variability of chlorophyll and hence of coastal primary productivity. The
high chlorophyll peaks occur each year from June to September, i.e. the cloudy season
39
Fig. 2.3 Average surface chlorophyll concentrations round the continent of Africa in July of 2008
(top left), 2009 (top right), 2010 (bottom left) and 2011 (bottom right). (MODIS Aqua data)
chlorophyll”) is therefore also plotted (green dotted line) for which the chlorophyll
value is reduced by the factor C/(1 + 0.2 C), where C is the chlorophyll concentration
in mg m
−3 . In Fig. 2.2, the effect is relatively small.
A second smaller peak appears later in most years in both chlorophyll and fluorescence, but is higher in the fluorescence than in chlorophyll in all years. The relation
between these two variables may indicate an average change in fluorescence yield
with season, for example, the later peak may be at a time of higher nutrient stress on
the phytoplankton, leading to relatively more fluorescence.
Figure 2.3 shows the July distribution in the years 2008, 2009, 2010 and 2011. The
major high-chlorophyll areas are present in all years, but with significant changes
in extent and concentration. Figure 2.4 shows the series of averages for the Horn
of Africa, where high values are seen in Figs. 2.1 and 2.3. Figure 2.4 shows the
interannual variability of chlorophyll and hence of coastal primary productivity. The
high chlorophyll peaks occur each year from June to September, i.e. the cloudy season