

19 Satellite Surveys of Lagoon and Coastal Waters . . .
395
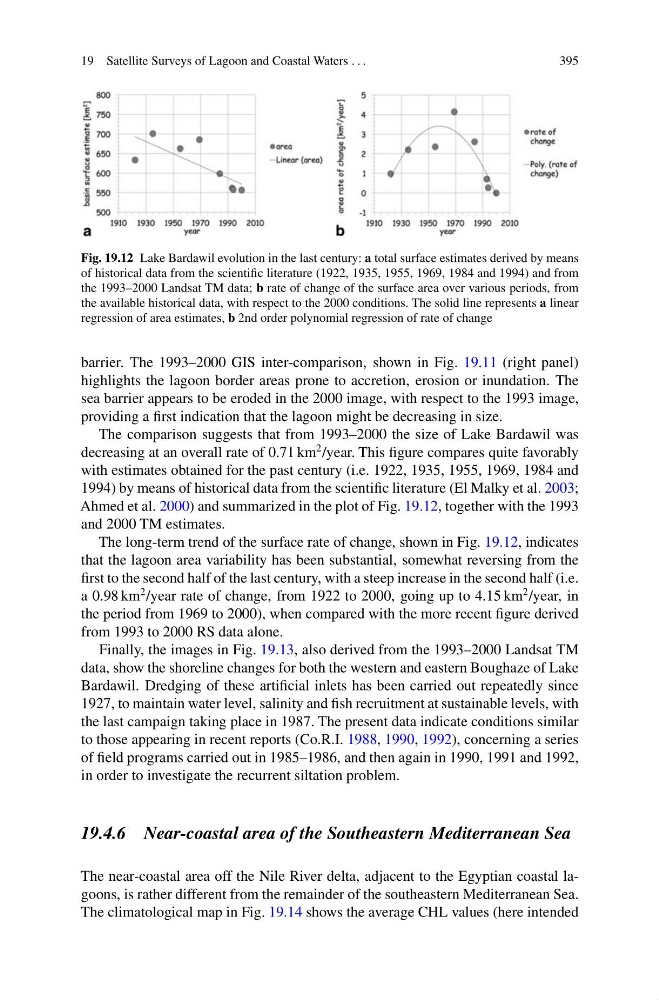
Fig. 19.12 Lake Bardawil evolution in the last century: a total surface estimates derived by means
of historical data from the scientific literature (1922, 1935, 1955, 1969, 1984 and 1994) and from
the 1993–2000 Landsat TM data; b rate of change of the surface area over various periods, from
the available historical data, with respect to the 2000 conditions. The solid line represents a linear
regression of area estimates, b 2nd order polynomial regression of rate of change
barrier. The 1993–2000 GIS inter-comparison, shown in Fig. 19.11 (right panel)
highlights the lagoon border areas prone to accretion, erosion or inundation. The
sea barrier appears to be eroded in the 2000 image, with respect to the 1993 image,
providing a first indication that the lagoon might be decreasing in size.
The comparison suggests that from 1993–2000 the size of Lake Bardawil was
decreasing at an overall rate of 0.71 km
2 /year. This figure compares quite favorably
with estimates obtained for the past century (i.e. 1922, 1935, 1955, 1969, 1984 and
1994) by means of historical data from the scientific literature (El Malky et al. 2003;
Ahmed et al. 2000) and summarized in the plot of Fig. 19.12, together with the 1993
and 2000 TM estimates.
The long-term trend of the surface rate of change, shown in Fig. 19.12, indicates
that the lagoon area variability has been substantial, somewhat reversing from the
first to the second half of the last century, with a steep increase in the second half (i.e.
a 0.98 km
2 /year rate of change, from 1922 to 2000, going up to 4.15 km
2 /year, in
the period from 1969 to 2000), when compared with the more recent figure derived
from 1993 to 2000 RS data alone.
Finally, the images in Fig. 19.13, also derived from the 1993–2000 Landsat TM
data, show the shoreline changes for both the western and eastern Boughaze of Lake
Bardawil. Dredging of these artificial inlets has been carried out repeatedly since
1927, to maintain water level, salinity and fish recruitment at sustainable levels, with
the last campaign taking place in 1987. The present data indicate conditions similar
to those appearing in recent reports (Co.R.I. 1988, 1990, 1992), concerning a series
of field programs carried out in 1985–1986, and then again in 1990, 1991 and 1992,
in order to investigate the recurrent siltation problem.
19.4.6 Near-coastal area of the Southeastern Mediterranean Sea
The near-coastal area off the Nile River delta, adjacent to the Egyptian coastal lagoons, is rather different from the remainder of the southeastern Mediterranean Sea.
The climatological map in Fig. 19.14 shows the average CHL values (here intended
395
Fig. 19.12 Lake Bardawil evolution in the last century: a total surface estimates derived by means
of historical data from the scientific literature (1922, 1935, 1955, 1969, 1984 and 1994) and from
the 1993–2000 Landsat TM data; b rate of change of the surface area over various periods, from
the available historical data, with respect to the 2000 conditions. The solid line represents a linear
regression of area estimates, b 2nd order polynomial regression of rate of change
barrier. The 1993–2000 GIS inter-comparison, shown in Fig. 19.11 (right panel)
highlights the lagoon border areas prone to accretion, erosion or inundation. The
sea barrier appears to be eroded in the 2000 image, with respect to the 1993 image,
providing a first indication that the lagoon might be decreasing in size.
The comparison suggests that from 1993–2000 the size of Lake Bardawil was
decreasing at an overall rate of 0.71 km
2 /year. This figure compares quite favorably
with estimates obtained for the past century (i.e. 1922, 1935, 1955, 1969, 1984 and
1994) by means of historical data from the scientific literature (El Malky et al. 2003;
Ahmed et al. 2000) and summarized in the plot of Fig. 19.12, together with the 1993
and 2000 TM estimates.
The long-term trend of the surface rate of change, shown in Fig. 19.12, indicates
that the lagoon area variability has been substantial, somewhat reversing from the
first to the second half of the last century, with a steep increase in the second half (i.e.
a 0.98 km
2 /year rate of change, from 1922 to 2000, going up to 4.15 km
2 /year, in
the period from 1969 to 2000), when compared with the more recent figure derived
from 1993 to 2000 RS data alone.
Finally, the images in Fig. 19.13, also derived from the 1993–2000 Landsat TM
data, show the shoreline changes for both the western and eastern Boughaze of Lake
Bardawil. Dredging of these artificial inlets has been carried out repeatedly since
1927, to maintain water level, salinity and fish recruitment at sustainable levels, with
the last campaign taking place in 1987. The present data indicate conditions similar
to those appearing in recent reports (Co.R.I. 1988, 1990, 1992), concerning a series
of field programs carried out in 1985–1986, and then again in 1990, 1991 and 1992,
in order to investigate the recurrent siltation problem.
19.4.6 Near-coastal area of the Southeastern Mediterranean Sea
The near-coastal area off the Nile River delta, adjacent to the Egyptian coastal lagoons, is rather different from the remainder of the southeastern Mediterranean Sea.
The climatological map in Fig. 19.14 shows the average CHL values (here intended