

392
M. Ahmed and V. Barale
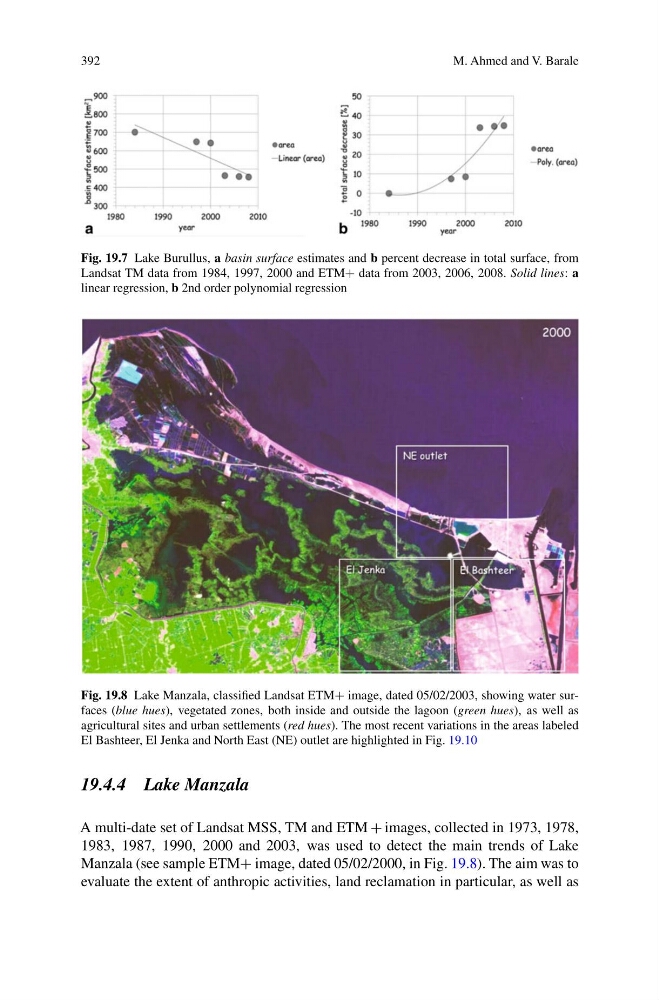
Fig. 19.7 Lake Burullus, a basin surface estimates and b percent decrease in total surface, from
Landsat TM data from 1984, 1997, 2000 and ETM+ data from 2003, 2006, 2008. Solid lines: a
linear regression, b 2nd order polynomial regression
Fig. 19.8 Lake Manzala, classified Landsat ETM+ image, dated 05/02/2003, showing water surfaces (blue hues), vegetated zones, both inside and outside the lagoon (green hues), as well as
agricultural sites and urban settlements (red hues). The most recent variations in the areas labeled
El Bashteer, El Jenka and North East (NE) outlet are highlighted in Fig. 19.10
19.4.4 Lake Manzala
A multi-date set of Landsat MSS, TM and ETM + images, collected in 1973, 1978,
1983, 1987, 1990, 2000 and 2003, was used to detect the main trends of Lake
Manzala (see sample ETM+ image, dated 05/02/2000, in Fig. 19.8). The aim was to
evaluate the extent of anthropic activities, land reclamation in particular, as well as
M. Ahmed and V. Barale
Fig. 19.7 Lake Burullus, a basin surface estimates and b percent decrease in total surface, from
Landsat TM data from 1984, 1997, 2000 and ETM+ data from 2003, 2006, 2008. Solid lines: a
linear regression, b 2nd order polynomial regression
Fig. 19.8 Lake Manzala, classified Landsat ETM+ image, dated 05/02/2003, showing water surfaces (blue hues), vegetated zones, both inside and outside the lagoon (green hues), as well as
agricultural sites and urban settlements (red hues). The most recent variations in the areas labeled
El Bashteer, El Jenka and North East (NE) outlet are highlighted in Fig. 19.10
19.4.4 Lake Manzala
A multi-date set of Landsat MSS, TM and ETM + images, collected in 1973, 1978,
1983, 1987, 1990, 2000 and 2003, was used to detect the main trends of Lake
Manzala (see sample ETM+ image, dated 05/02/2000, in Fig. 19.8). The aim was to
evaluate the extent of anthropic activities, land reclamation in particular, as well as