

19 Satellite Surveys of Lagoon and Coastal Waters . . .
391
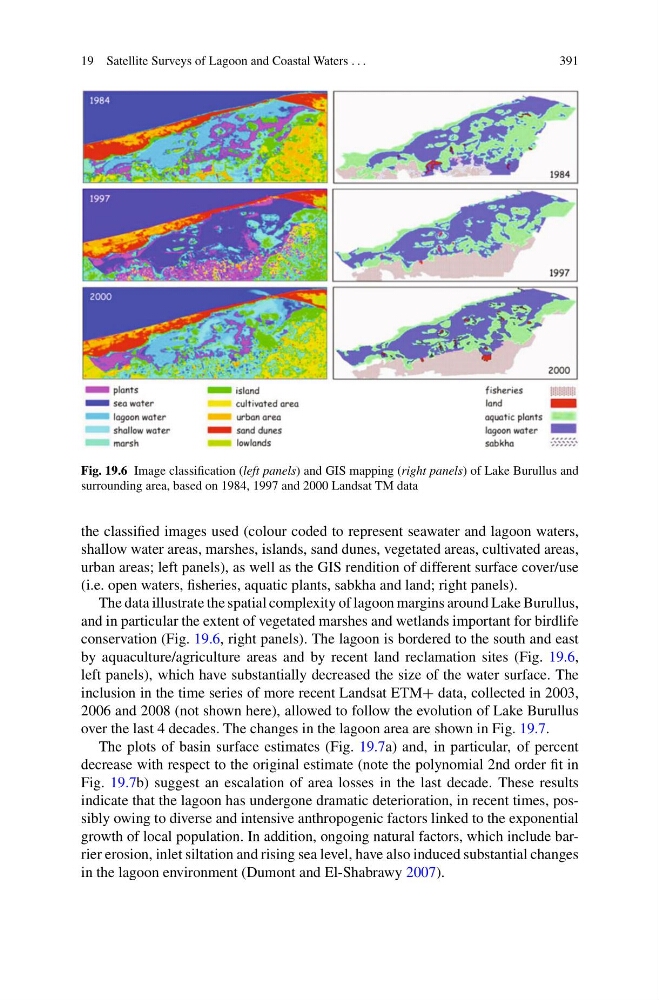
Fig. 19.6 Image classification (left panels) and GIS mapping (right panels) of Lake Burullus and
surrounding area, based on 1984, 1997 and 2000 Landsat TM data
the classified images used (colour coded to represent seawater and lagoon waters,
shallow water areas, marshes, islands, sand dunes, vegetated areas, cultivated areas,
urban areas; left panels), as well as the GIS rendition of different surface cover/use
(i.e. open waters, fisheries, aquatic plants, sabkha and land; right panels).
The data illustrate the spatial complexity of lagoon margins around Lake Burullus,
and in particular the extent of vegetated marshes and wetlands important for birdlife
conservation (Fig. 19.6, right panels). The lagoon is bordered to the south and east
by aquaculture/agriculture areas and by recent land reclamation sites (Fig. 19.6,
left panels), which have substantially decreased the size of the water surface. The
inclusion in the time series of more recent Landsat ETM+ data, collected in 2003,
2006 and 2008 (not shown here), allowed to follow the evolution of Lake Burullus
over the last 4 decades. The changes in the lagoon area are shown in Fig. 19.7.
The plots of basin surface estimates (Fig. 19.7a) and, in particular, of percent
decrease with respect to the original estimate (note the polynomial 2nd order fit in
Fig. 19.7b) suggest an escalation of area losses in the last decade. These results
indicate that the lagoon has undergone dramatic deterioration, in recent times, possibly owing to diverse and intensive anthropogenic factors linked to the exponential
growth of local population. In addition, ongoing natural factors, which include barrier erosion, inlet siltation and rising sea level, have also induced substantial changes
in the lagoon environment (Dumont and El-Shabrawy 2007).
391
Fig. 19.6 Image classification (left panels) and GIS mapping (right panels) of Lake Burullus and
surrounding area, based on 1984, 1997 and 2000 Landsat TM data
the classified images used (colour coded to represent seawater and lagoon waters,
shallow water areas, marshes, islands, sand dunes, vegetated areas, cultivated areas,
urban areas; left panels), as well as the GIS rendition of different surface cover/use
(i.e. open waters, fisheries, aquatic plants, sabkha and land; right panels).
The data illustrate the spatial complexity of lagoon margins around Lake Burullus,
and in particular the extent of vegetated marshes and wetlands important for birdlife
conservation (Fig. 19.6, right panels). The lagoon is bordered to the south and east
by aquaculture/agriculture areas and by recent land reclamation sites (Fig. 19.6,
left panels), which have substantially decreased the size of the water surface. The
inclusion in the time series of more recent Landsat ETM+ data, collected in 2003,
2006 and 2008 (not shown here), allowed to follow the evolution of Lake Burullus
over the last 4 decades. The changes in the lagoon area are shown in Fig. 19.7.
The plots of basin surface estimates (Fig. 19.7a) and, in particular, of percent
decrease with respect to the original estimate (note the polynomial 2nd order fit in
Fig. 19.7b) suggest an escalation of area losses in the last decade. These results
indicate that the lagoon has undergone dramatic deterioration, in recent times, possibly owing to diverse and intensive anthropogenic factors linked to the exponential
growth of local population. In addition, ongoing natural factors, which include barrier erosion, inlet siltation and rising sea level, have also induced substantial changes
in the lagoon environment (Dumont and El-Shabrawy 2007).