

390
M. Ahmed and V. Barale
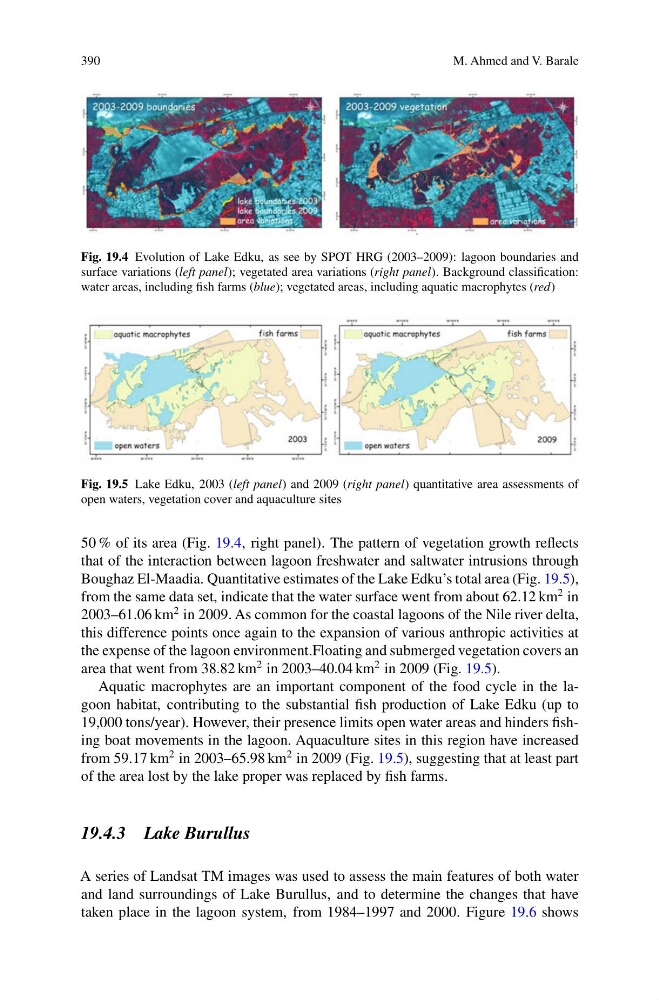
Fig. 19.4 Evolution of Lake Edku, as see by SPOT HRG (2003–2009): lagoon boundaries and
surface variations (left panel); vegetated area variations (right panel). Background classification:
water areas, including fish farms (blue); vegetated areas, including aquatic macrophytes (red)
Fig. 19.5 Lake Edku, 2003 (left panel) and 2009 (right panel) quantitative area assessments of
open waters, vegetation cover and aquaculture sites
50 % of its area (Fig. 19.4, right panel). The pattern of vegetation growth reflects
that of the interaction between lagoon freshwater and saltwater intrusions through
Boughaz El-Maadia. Quantitative estimates of the Lake Edku’s total area (Fig. 19.5),
from the same data set, indicate that the water surface went from about 62.12 km
2 in
2003–61.06 km
2 in 2009. As common for the coastal lagoons of the Nile river delta,
this difference points once again to the expansion of various anthropic activities at
the expense of the lagoon environment.Floating and submerged vegetation covers an
area that went from 38.82 km
2 in 2003–40.04 km
2 in 2009 (Fig. 19.5).
Aquatic macrophytes are an important component of the food cycle in the lagoon habitat, contributing to the substantial fish production of Lake Edku (up to
19,000 tons/year). However, their presence limits open water areas and hinders fishing boat movements in the lagoon. Aquaculture sites in this region have increased
from 59.17 km
2 in 2003–65.98 km
2 in 2009 (Fig. 19.5), suggesting that at least part
of the area lost by the lake proper was replaced by fish farms.
19.4.3 Lake Burullus
A series of Landsat TM images was used to assess the main features of both water
and land surroundings of Lake Burullus, and to determine the changes that have
taken place in the lagoon system, from 1984–1997 and 2000. Figure 19.6 shows
M. Ahmed and V. Barale
Fig. 19.4 Evolution of Lake Edku, as see by SPOT HRG (2003–2009): lagoon boundaries and
surface variations (left panel); vegetated area variations (right panel). Background classification:
water areas, including fish farms (blue); vegetated areas, including aquatic macrophytes (red)
Fig. 19.5 Lake Edku, 2003 (left panel) and 2009 (right panel) quantitative area assessments of
open waters, vegetation cover and aquaculture sites
50 % of its area (Fig. 19.4, right panel). The pattern of vegetation growth reflects
that of the interaction between lagoon freshwater and saltwater intrusions through
Boughaz El-Maadia. Quantitative estimates of the Lake Edku’s total area (Fig. 19.5),
from the same data set, indicate that the water surface went from about 62.12 km
2 in
2003–61.06 km
2 in 2009. As common for the coastal lagoons of the Nile river delta,
this difference points once again to the expansion of various anthropic activities at
the expense of the lagoon environment.Floating and submerged vegetation covers an
area that went from 38.82 km
2 in 2003–40.04 km
2 in 2009 (Fig. 19.5).
Aquatic macrophytes are an important component of the food cycle in the lagoon habitat, contributing to the substantial fish production of Lake Edku (up to
19,000 tons/year). However, their presence limits open water areas and hinders fishing boat movements in the lagoon. Aquaculture sites in this region have increased
from 59.17 km
2 in 2003–65.98 km
2 in 2009 (Fig. 19.5), suggesting that at least part
of the area lost by the lake proper was replaced by fish farms.
19.4.3 Lake Burullus
A series of Landsat TM images was used to assess the main features of both water
and land surroundings of Lake Burullus, and to determine the changes that have
taken place in the lagoon system, from 1984–1997 and 2000. Figure 19.6 shows