

19 Satellite Surveys of Lagoon and Coastal Waters . . .
389
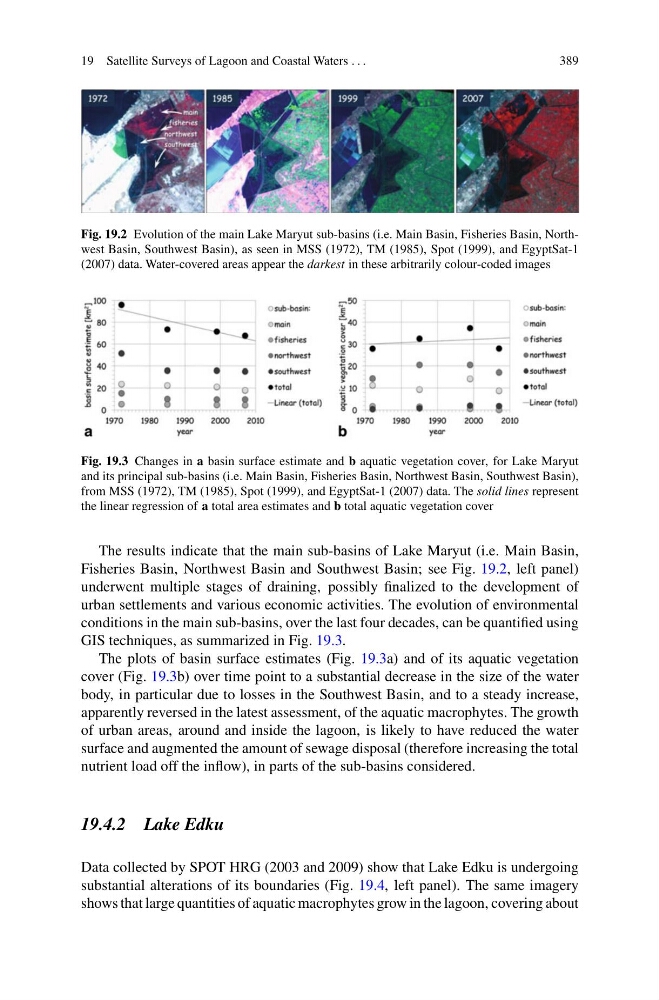
Fig. 19.2 Evolution of the main Lake Maryut sub-basins (i.e. Main Basin, Fisheries Basin, Northwest Basin, Southwest Basin), as seen in MSS (1972), TM (1985), Spot (1999), and EgyptSat-1
(2007) data. Water-covered areas appear the darkest in these arbitrarily colour-coded images
Fig. 19.3 Changes in a basin surface estimate and b aquatic vegetation cover, for Lake Maryut
and its principal sub-basins (i.e. Main Basin, Fisheries Basin, Northwest Basin, Southwest Basin),
from MSS (1972), TM (1985), Spot (1999), and EgyptSat-1 (2007) data. The solid lines represent
the linear regression of a total area estimates and b total aquatic vegetation cover
The results indicate that the main sub-basins of Lake Maryut (i.e. Main Basin,
Fisheries Basin, Northwest Basin and Southwest Basin; see Fig. 19.2, left panel)
underwent multiple stages of draining, possibly finalized to the development of
urban settlements and various economic activities. The evolution of environmental
conditions in the main sub-basins, over the last four decades, can be quantified using
GIS techniques, as summarized in Fig. 19.3.
The plots of basin surface estimates (Fig. 19.3a) and of its aquatic vegetation
cover (Fig. 19.3b) over time point to a substantial decrease in the size of the water
body, in particular due to losses in the Southwest Basin, and to a steady increase,
apparently reversed in the latest assessment, of the aquatic macrophytes. The growth
of urban areas, around and inside the lagoon, is likely to have reduced the water
surface and augmented the amount of sewage disposal (therefore increasing the total
nutrient load off the inflow), in parts of the sub-basins considered.
19.4.2 Lake Edku
Data collected by SPOT HRG (2003 and 2009) show that Lake Edku is undergoing
substantial alterations of its boundaries (Fig. 19.4, left panel). The same imagery
shows that large quantities of aquatic macrophytes grow in the lagoon, covering about
389
Fig. 19.2 Evolution of the main Lake Maryut sub-basins (i.e. Main Basin, Fisheries Basin, Northwest Basin, Southwest Basin), as seen in MSS (1972), TM (1985), Spot (1999), and EgyptSat-1
(2007) data. Water-covered areas appear the darkest in these arbitrarily colour-coded images
Fig. 19.3 Changes in a basin surface estimate and b aquatic vegetation cover, for Lake Maryut
and its principal sub-basins (i.e. Main Basin, Fisheries Basin, Northwest Basin, Southwest Basin),
from MSS (1972), TM (1985), Spot (1999), and EgyptSat-1 (2007) data. The solid lines represent
the linear regression of a total area estimates and b total aquatic vegetation cover
The results indicate that the main sub-basins of Lake Maryut (i.e. Main Basin,
Fisheries Basin, Northwest Basin and Southwest Basin; see Fig. 19.2, left panel)
underwent multiple stages of draining, possibly finalized to the development of
urban settlements and various economic activities. The evolution of environmental
conditions in the main sub-basins, over the last four decades, can be quantified using
GIS techniques, as summarized in Fig. 19.3.
The plots of basin surface estimates (Fig. 19.3a) and of its aquatic vegetation
cover (Fig. 19.3b) over time point to a substantial decrease in the size of the water
body, in particular due to losses in the Southwest Basin, and to a steady increase,
apparently reversed in the latest assessment, of the aquatic macrophytes. The growth
of urban areas, around and inside the lagoon, is likely to have reduced the water
surface and augmented the amount of sewage disposal (therefore increasing the total
nutrient load off the inflow), in parts of the sub-basins considered.
19.4.2 Lake Edku
Data collected by SPOT HRG (2003 and 2009) show that Lake Edku is undergoing
substantial alterations of its boundaries (Fig. 19.4, left panel). The same imagery
shows that large quantities of aquatic macrophytes grow in the lagoon, covering about