

18 Eddies in the Red Sea as seen by Satellite SAR Imagery
367
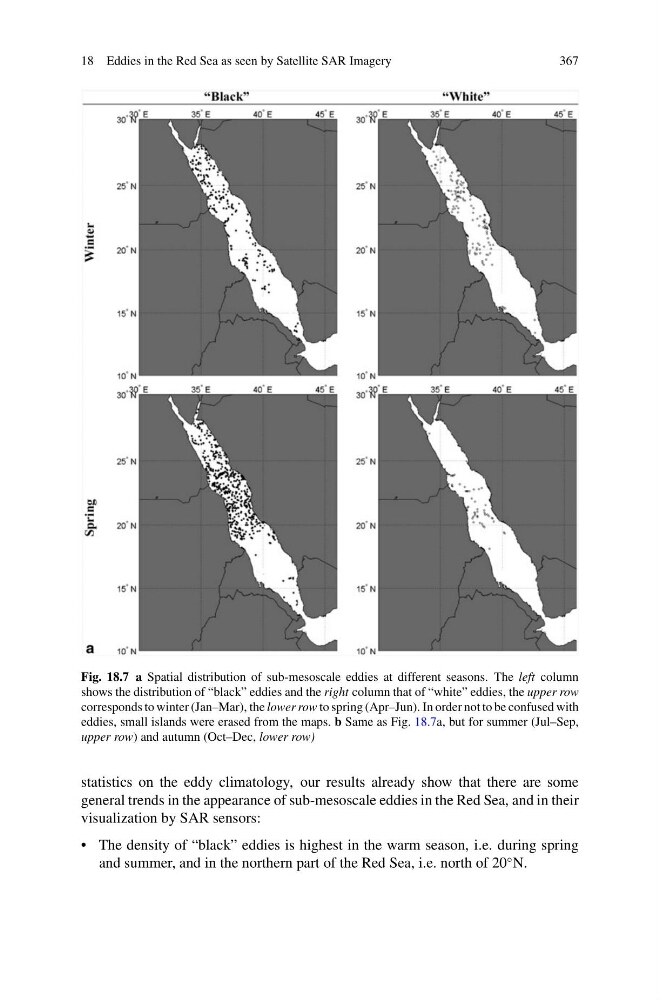
Fig. 18.7 a Spatial distribution of sub-mesoscale eddies at different seasons. The left column
shows the distribution of “black” eddies and the right column that of “white” eddies, the upper row
corresponds to winter (Jan–Mar), the lower row to spring (Apr–Jun). In order not to be confused with
eddies, small islands were erased from the maps. b Same as Fig. 18.7a, but for summer (Jul–Sep,
upper row) and autumn (Oct–Dec, lower row)
statistics on the eddy climatology, our results already show that there are some
general trends in the appearance of sub-mesoscale eddies in the Red Sea, and in their
visualization by SAR sensors:
• The density of “black” eddies is highest in the warm season, i.e. during spring
and summer, and in the northern part of the Red Sea, i.e. north of 20
◦ N.
367
Fig. 18.7 a Spatial distribution of sub-mesoscale eddies at different seasons. The left column
shows the distribution of “black” eddies and the right column that of “white” eddies, the upper row
corresponds to winter (Jan–Mar), the lower row to spring (Apr–Jun). In order not to be confused with
eddies, small islands were erased from the maps. b Same as Fig. 18.7a, but for summer (Jul–Sep,
upper row) and autumn (Oct–Dec, lower row)
statistics on the eddy climatology, our results already show that there are some
general trends in the appearance of sub-mesoscale eddies in the Red Sea, and in their
visualization by SAR sensors:
• The density of “black” eddies is highest in the warm season, i.e. during spring
and summer, and in the northern part of the Red Sea, i.e. north of 20
◦ N.