

366
S. S. Karimova and M. Gade
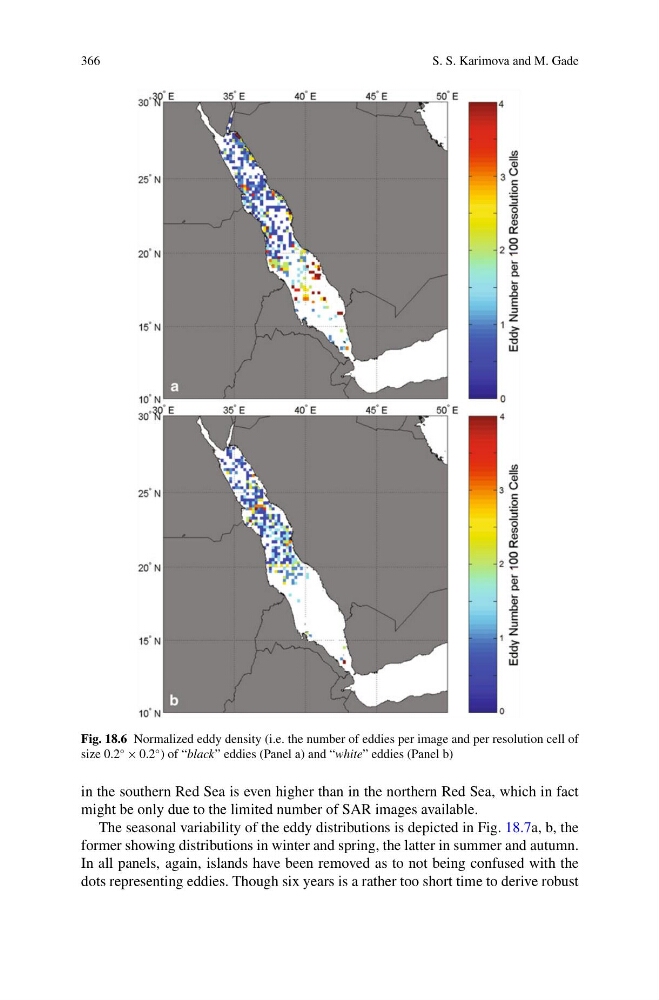
Fig. 18.6 Normalized eddy density (i.e. the number of eddies per image and per resolution cell of
size 0.2
◦ × 0.2
◦ ) of “black” eddies (Panel a) and “white” eddies (Panel b)
in the southern Red Sea is even higher than in the northern Red Sea, which in fact
might be only due to the limited number of SAR images available.
The seasonal variability of the eddy distributions is depicted in Fig. 18.7a, b, the
former showing distributions in winter and spring, the latter in summer and autumn.
In all panels, again, islands have been removed as to not being confused with the
dots representing eddies. Though six years is a rather too short time to derive robust
S. S. Karimova and M. Gade
Fig. 18.6 Normalized eddy density (i.e. the number of eddies per image and per resolution cell of
size 0.2
◦ × 0.2
◦ ) of “black” eddies (Panel a) and “white” eddies (Panel b)
in the southern Red Sea is even higher than in the northern Red Sea, which in fact
might be only due to the limited number of SAR images available.
The seasonal variability of the eddy distributions is depicted in Fig. 18.7a, b, the
former showing distributions in winter and spring, the latter in summer and autumn.
In all panels, again, islands have been removed as to not being confused with the
dots representing eddies. Though six years is a rather too short time to derive robust