

344
V. Barale and M. Gade
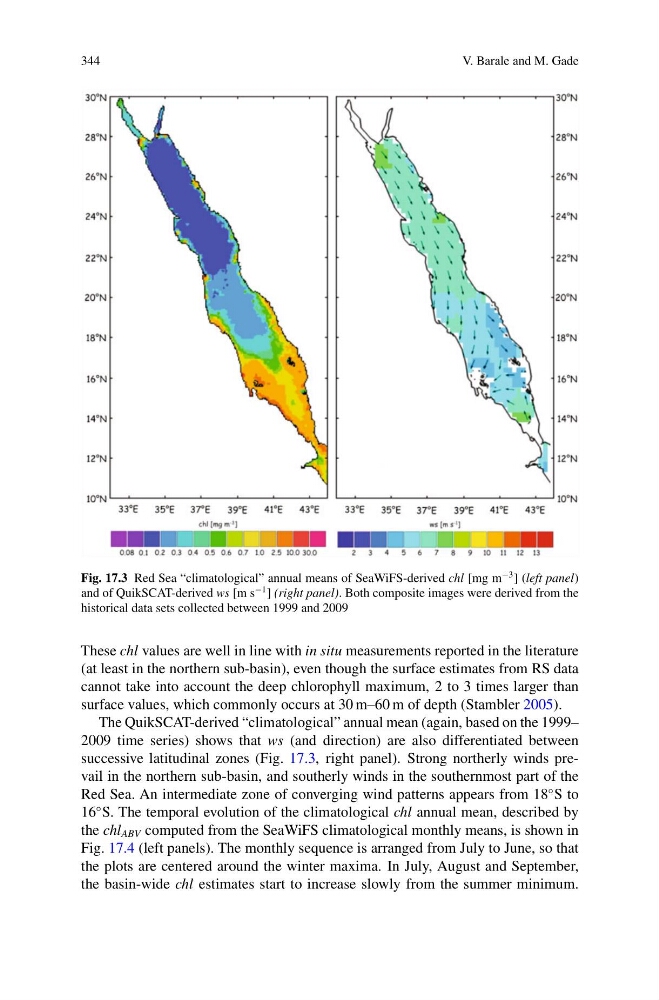
Fig. 17.3 Red Sea “climatological” annual means of SeaWiFS-derived chl [mg m
−3 ] (left panel)
and of QuikSCAT-derived ws [m s
−1 ] (right panel). Both composite images were derived from the
historical data sets collected between 1999 and 2009
These chl values are well in line with in situ measurements reported in the literature
(at least in the northern sub-basin), even though the surface estimates from RS data
cannot take into account the deep chlorophyll maximum, 2 to 3 times larger than
surface values, which commonly occurs at 30 m–60 m of depth (Stambler 2005).
The QuikSCAT-derived “climatological” annual mean (again, based on the 1999–
2009 time series) shows that ws (and direction) are also differentiated between
successive latitudinal zones (Fig. 17.3, right panel). Strong northerly winds prevail in the northern sub-basin, and southerly winds in the southernmost part of the
Red Sea. An intermediate zone of converging wind patterns appears from 18
◦ S to
16
◦ S. The temporal evolution of the climatological chl annual mean, described by
the chl ABV computed from the SeaWiFS climatological monthly means, is shown in
Fig. 17.4 (left panels). The monthly sequence is arranged from July to June, so that
the plots are centered around the winter maxima. In July, August and September,
the basin-wide chl estimates start to increase slowly from the summer minimum.
V. Barale and M. Gade
Fig. 17.3 Red Sea “climatological” annual means of SeaWiFS-derived chl [mg m
−3 ] (left panel)
and of QuikSCAT-derived ws [m s
−1 ] (right panel). Both composite images were derived from the
historical data sets collected between 1999 and 2009
These chl values are well in line with in situ measurements reported in the literature
(at least in the northern sub-basin), even though the surface estimates from RS data
cannot take into account the deep chlorophyll maximum, 2 to 3 times larger than
surface values, which commonly occurs at 30 m–60 m of depth (Stambler 2005).
The QuikSCAT-derived “climatological” annual mean (again, based on the 1999–
2009 time series) shows that ws (and direction) are also differentiated between
successive latitudinal zones (Fig. 17.3, right panel). Strong northerly winds prevail in the northern sub-basin, and southerly winds in the southernmost part of the
Red Sea. An intermediate zone of converging wind patterns appears from 18
◦ S to
16
◦ S. The temporal evolution of the climatological chl annual mean, described by
the chl ABV computed from the SeaWiFS climatological monthly means, is shown in
Fig. 17.4 (left panels). The monthly sequence is arranged from July to June, so that
the plots are centered around the winter maxima. In July, August and September,
the basin-wide chl estimates start to increase slowly from the summer minimum.