

17 Basic Ecosystem Dynamics in the Red Sea as Seen by Sundry . . .
343
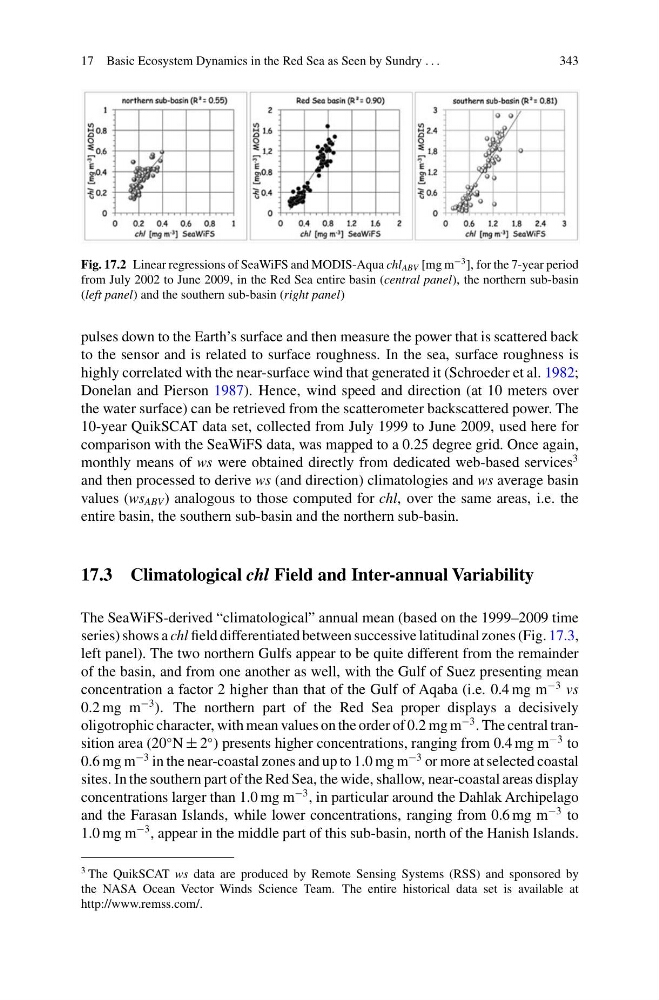
Fig. 17.2 Linear regressions of SeaWiFS and MODIS-Aqua chl ABV [mg m
−3 ], for the 7-year period
from July 2002 to June 2009, in the Red Sea entire basin (central panel), the northern sub-basin
(left panel) and the southern sub-basin (right panel)
pulses down to the Earth’s surface and then measure the power that is scattered back
to the sensor and is related to surface roughness. In the sea, surface roughness is
highly correlated with the near-surface wind that generated it (Schroeder et al. 1982;
Donelan and Pierson 1987). Hence, wind speed and direction (at 10 meters over
the water surface) can be retrieved from the scatterometer backscattered power. The
10-year QuikSCAT data set, collected from July 1999 to June 2009, used here for
comparison with the SeaWiFS data, was mapped to a 0.25 degree grid. Once again,
monthly means of ws were obtained directly from dedicated web-based services
3
and then processed to derive ws (and direction) climatologies and ws average basin
values (ws ABV ) analogous to those computed for chl, over the same areas, i.e. the
entire basin, the southern sub-basin and the northern sub-basin.
17.3 Climatological chl Field and Inter-annual Variability
The SeaWiFS-derived “climatological” annual mean (based on the 1999–2009 time
series) shows a chl field differentiated between successive latitudinal zones (Fig. 17.3,
left panel). The two northern Gulfs appear to be quite different from the remainder
of the basin, and from one another as well, with the Gulf of Suez presenting mean
concentration a factor 2 higher than that of the Gulf of Aqaba (i.e. 0.4 mg m
−3 vs
0.2 mg m
−3 ). The northern part of the Red Sea proper displays a decisively
oligotrophic character, with mean values on the order of 0.2 mg m
−3 . The central transition area (20
◦ N ± 2
◦ ) presents higher concentrations, ranging from 0.4 mg m
−3 to
0.6 mg m
−3 in the near-coastal zones and up to 1.0 mg m
−3 or more at selected coastal
sites. In the southern part of the Red Sea, the wide, shallow, near-coastal areas display
concentrations larger than 1.0 mg m
−3 , in particular around the Dahlak Archipelago
and the Farasan Islands, while lower concentrations, ranging from 0.6 mg m
−3 to
1.0 mg m
−3 , appear in the middle part of this sub-basin, north of the Hanish Islands.
3 The QuikSCAT ws data are produced by Remote Sensing Systems (RSS) and sponsored by
the NASA Ocean Vector Winds Science Team. The entire historical data set is available at
http://www.remss.com/.
343
Fig. 17.2 Linear regressions of SeaWiFS and MODIS-Aqua chl ABV [mg m
−3 ], for the 7-year period
from July 2002 to June 2009, in the Red Sea entire basin (central panel), the northern sub-basin
(left panel) and the southern sub-basin (right panel)
pulses down to the Earth’s surface and then measure the power that is scattered back
to the sensor and is related to surface roughness. In the sea, surface roughness is
highly correlated with the near-surface wind that generated it (Schroeder et al. 1982;
Donelan and Pierson 1987). Hence, wind speed and direction (at 10 meters over
the water surface) can be retrieved from the scatterometer backscattered power. The
10-year QuikSCAT data set, collected from July 1999 to June 2009, used here for
comparison with the SeaWiFS data, was mapped to a 0.25 degree grid. Once again,
monthly means of ws were obtained directly from dedicated web-based services
3
and then processed to derive ws (and direction) climatologies and ws average basin
values (ws ABV ) analogous to those computed for chl, over the same areas, i.e. the
entire basin, the southern sub-basin and the northern sub-basin.
17.3 Climatological chl Field and Inter-annual Variability
The SeaWiFS-derived “climatological” annual mean (based on the 1999–2009 time
series) shows a chl field differentiated between successive latitudinal zones (Fig. 17.3,
left panel). The two northern Gulfs appear to be quite different from the remainder
of the basin, and from one another as well, with the Gulf of Suez presenting mean
concentration a factor 2 higher than that of the Gulf of Aqaba (i.e. 0.4 mg m
−3 vs
0.2 mg m
−3 ). The northern part of the Red Sea proper displays a decisively
oligotrophic character, with mean values on the order of 0.2 mg m
−3 . The central transition area (20
◦ N ± 2
◦ ) presents higher concentrations, ranging from 0.4 mg m
−3 to
0.6 mg m
−3 in the near-coastal zones and up to 1.0 mg m
−3 or more at selected coastal
sites. In the southern part of the Red Sea, the wide, shallow, near-coastal areas display
concentrations larger than 1.0 mg m
−3 , in particular around the Dahlak Archipelago
and the Farasan Islands, while lower concentrations, ranging from 0.6 mg m
−3 to
1.0 mg m
−3 , appear in the middle part of this sub-basin, north of the Hanish Islands.
3 The QuikSCAT ws data are produced by Remote Sensing Systems (RSS) and sponsored by
the NASA Ocean Vector Winds Science Team. The entire historical data set is available at
http://www.remss.com/.